
Verifying I/O Coupling Noise
One of the factors that cause connector cables to generate noise is a connected adjacent signal that is affected by crosstalk interference from the signal of a noise source. This is called "I/O coupling noise". The I/O coupling noise verification extracts signals that generate noise directly and signals connected to connector cables. It then analyzes the crosstalk interference between them, in order to calculate noise from the connector cables.
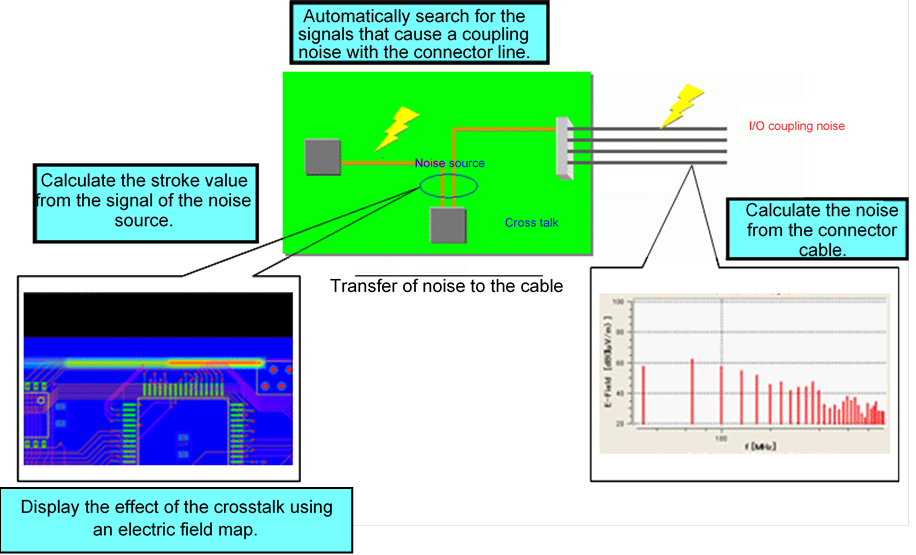
This topic describes how to identify I/O coupling noise from the analysis result, and visualize its impact in a color map. This is done by listing the relations that concern crosstalk interference, in order to find a signal (true noise source) that affects the signals connected to the cables.
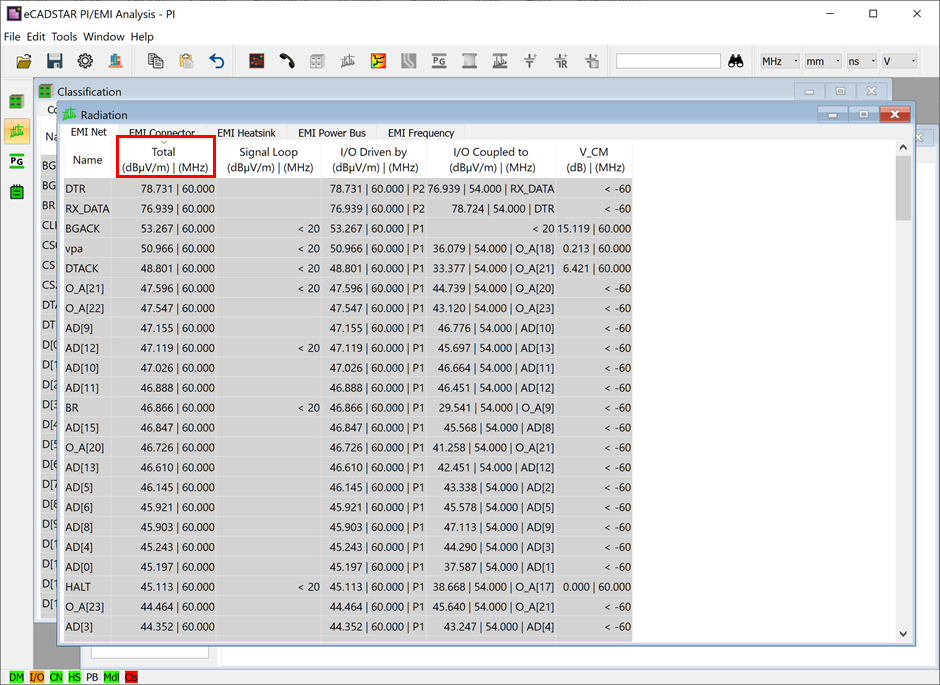
- In the Radiation view, select the EMI Net tab.
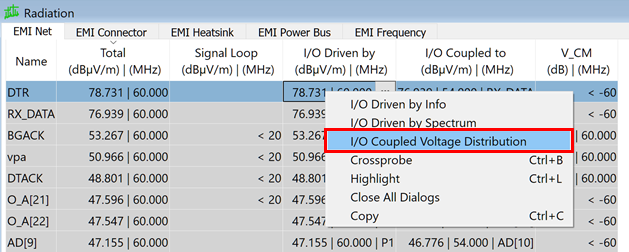
- Click the Total column label to sort the values in descending order. Total represents the peak value and frequency band of the EMI noise for each signal. Note that DTR is the signal with the highest value. This indicates that DTR is the primary EMI factor on this board.
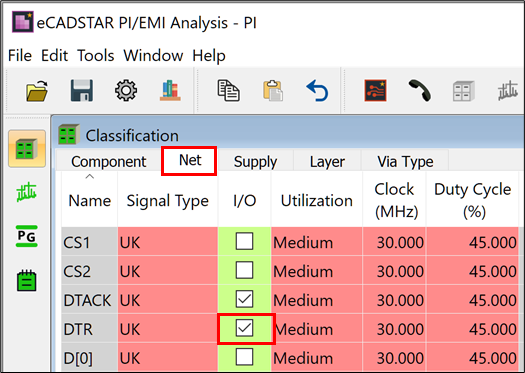
- Select Window > Classification to open the Classification view. Alternatively, press the Ctrl and 1 keys.
- Select the Net tab, and note that the I/O check box for DTR is selected. This indicates that the signal is connected to a connector, and that you can therefore confirm that DTR is the direct factor causing EMI noise from cables.
- Based on the current result, search for the actual cause by checking the I/O Driven by value of DTR. Do this as follows.
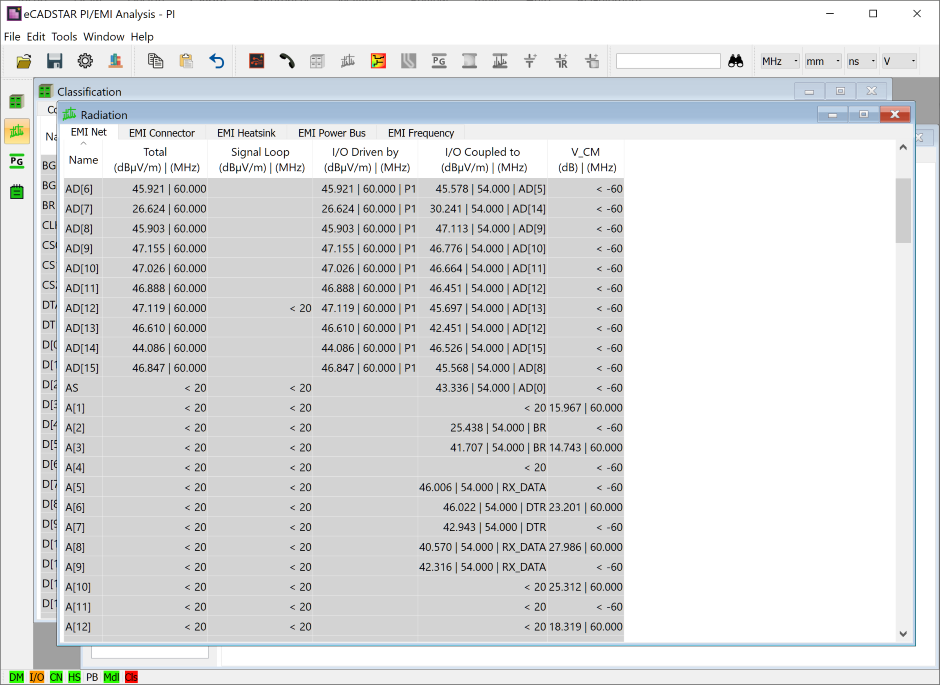
- Select the EMI Net tab in the Radiation view.
- Note that the Total and I/O Driven by values are the same. This indicates that I/O coupling noise is a primary factor, and is also affected by crosstalk interference from another source.
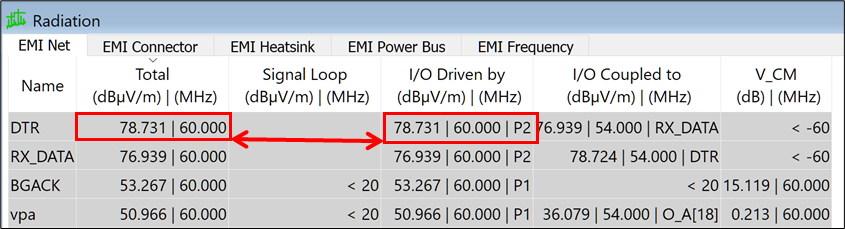
The I/O Driven by value shows the radiation noise caused by crosstalk interference from another signal.
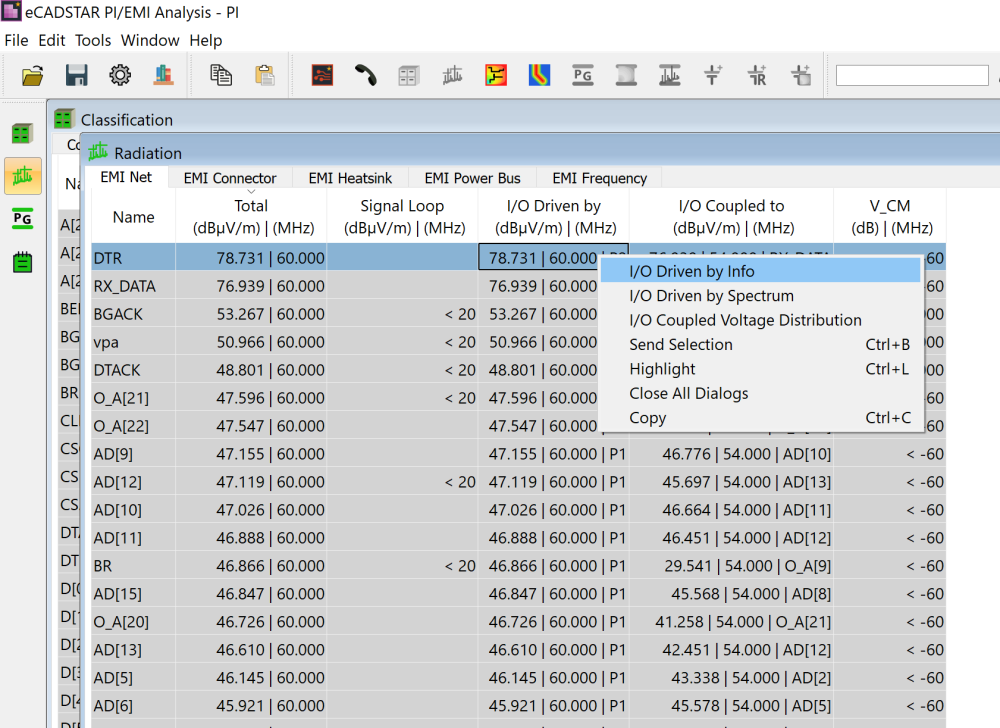
- Check a signal that affects DTR with crosstalk noise by right-clicking the cell, and selecting I/O Driven by Info for "DTR".
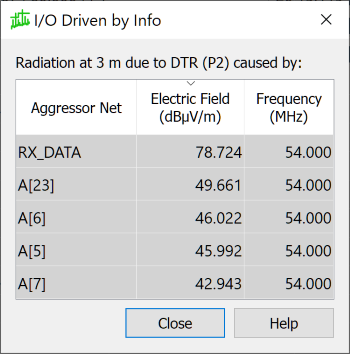
- The I/O Driven by Info dialog is displayed. The Aggressor Nets that emit crosstalk noise and their values are displayed in this dialog. This indicates that the signals are a source of the noise.
- Check the routing status on the board as follows.
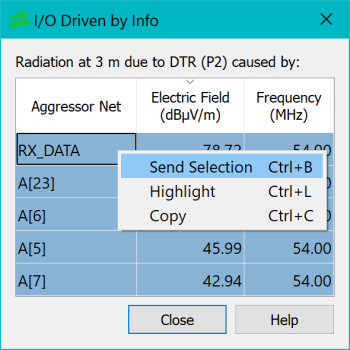
- Drag the cursor to select all the signals listed in the I/O Driven by Info dialog.
- Right-click, and select Send Selection on the assist menu.
- On the canvas in eCADSTAR PCB Editor, confirm that the specified signals are selected.
- Click Close to exit the I/O Driven by Info dialog.
- On the ribbon, select View > Canvas, and then select Lowlight and Highlight.
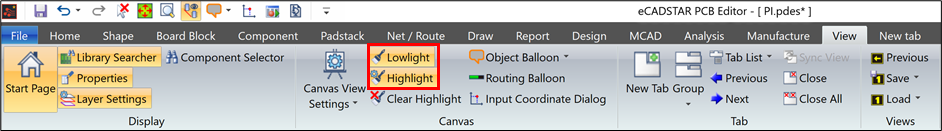
The Highlight Settings dialog is displayed.
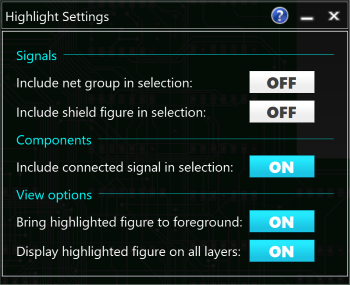
- Note that only the selected signals are displayed.
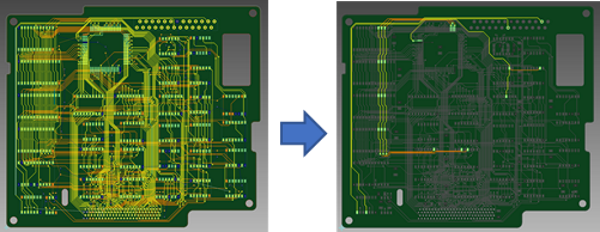
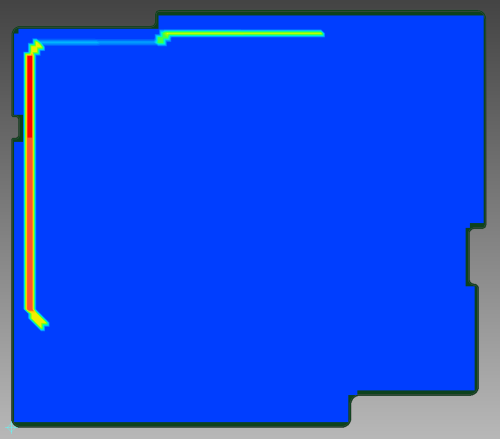
- Display the distribution of crosstalk noise on the canvas as follows.
- In the Radiation view of the PI/EMI Analysis module, right-click on the I/O Driven by cell for "DTR".
- Select I/O Coupled Voltage Distribution.
- The I/O coupling voltage distribution data are created for the selected signal. The PI/EMI Analysis Heatmap dialog is displayed, and the I/O coupling voltage distribution is displayed on the canvas.
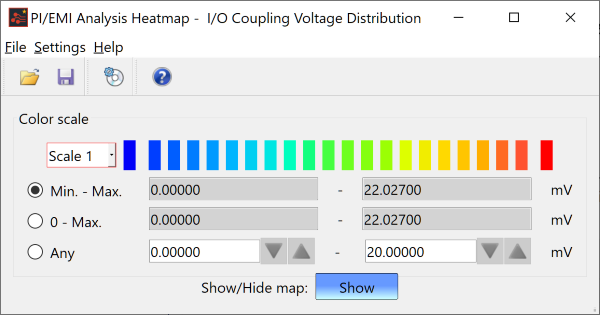
- Close the PI/EMI Analysis Heatmap dialog by clicking the X button.
The assignment of colors and numeric values can be specified in the Color scale section of the PI/EMI Analysis Heatmap dialog. You can select the following options. Depending on your requirements, you could select Min. - Max. or 0 - Max. to grasp the general distribution (longitudinal level). Alternatively, select Any to compare the data before and after measures were taken.
| Value | Description |
|---|---|
| Min. - Max. | Gradates the map from the minimum to the maximum I/O coupling voltage values of the analysis result. |
| 0 - Max. | Gradates the map from 0 to the maximum I/O coupling voltage value of the analysis result. |
| Any | Allows you to specify the range of the map to be gradated. You cannot enter a value that may reverse the minimum and maximum values. |
This task is demonstrated in the following video.
