
Performing EMI Analysis
This topic describes how to perform EMI Analysis, and check the results.
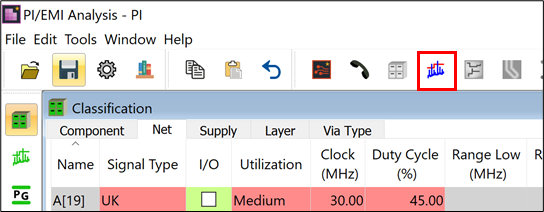
- On the toolbar, click
 EMI Analysis. EMI analysis is performed
for all signals on the board.
EMI Analysis. EMI analysis is performed
for all signals on the board.
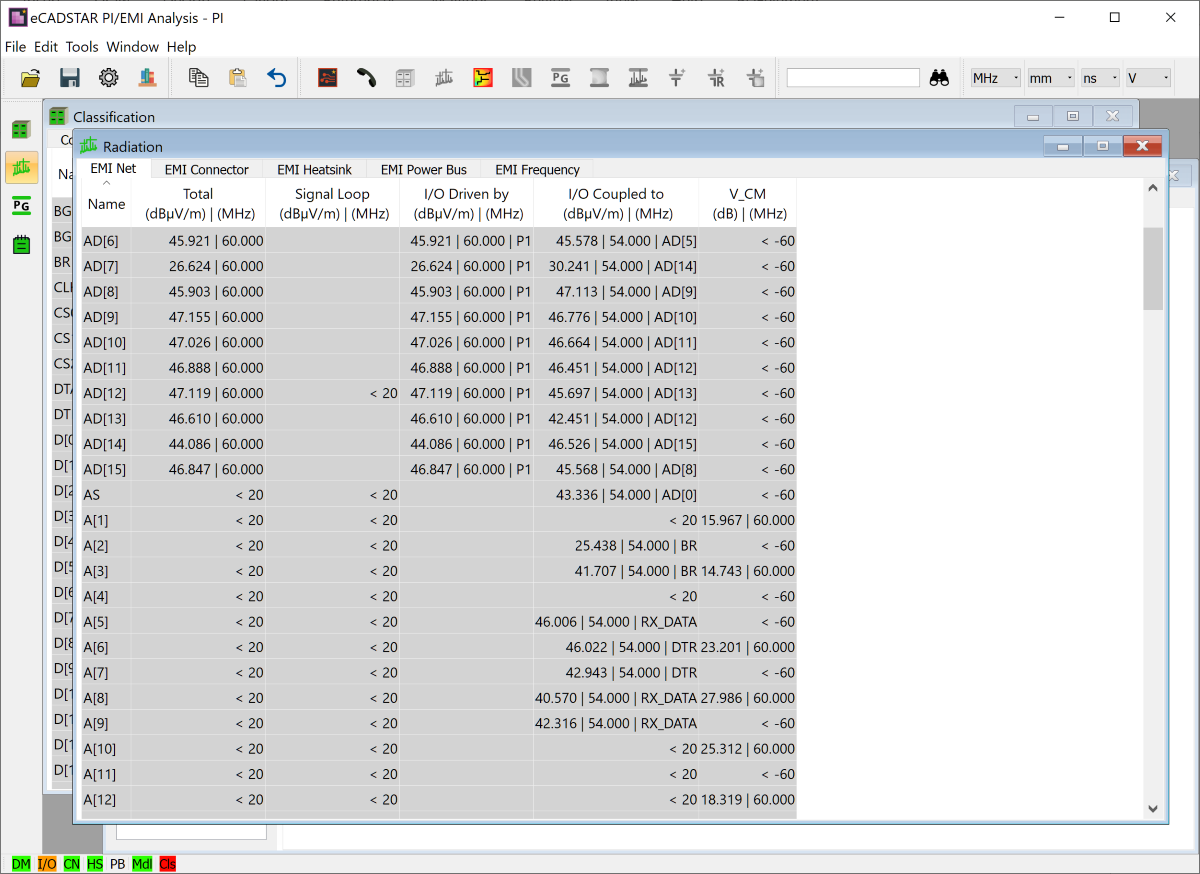
When the analysis is completed, the results are displayed in the Radiation view.
- Select the EMI Frequency tab in the Radiation view. This tab shows the relation between factors causing EMI, and the frequency bands.
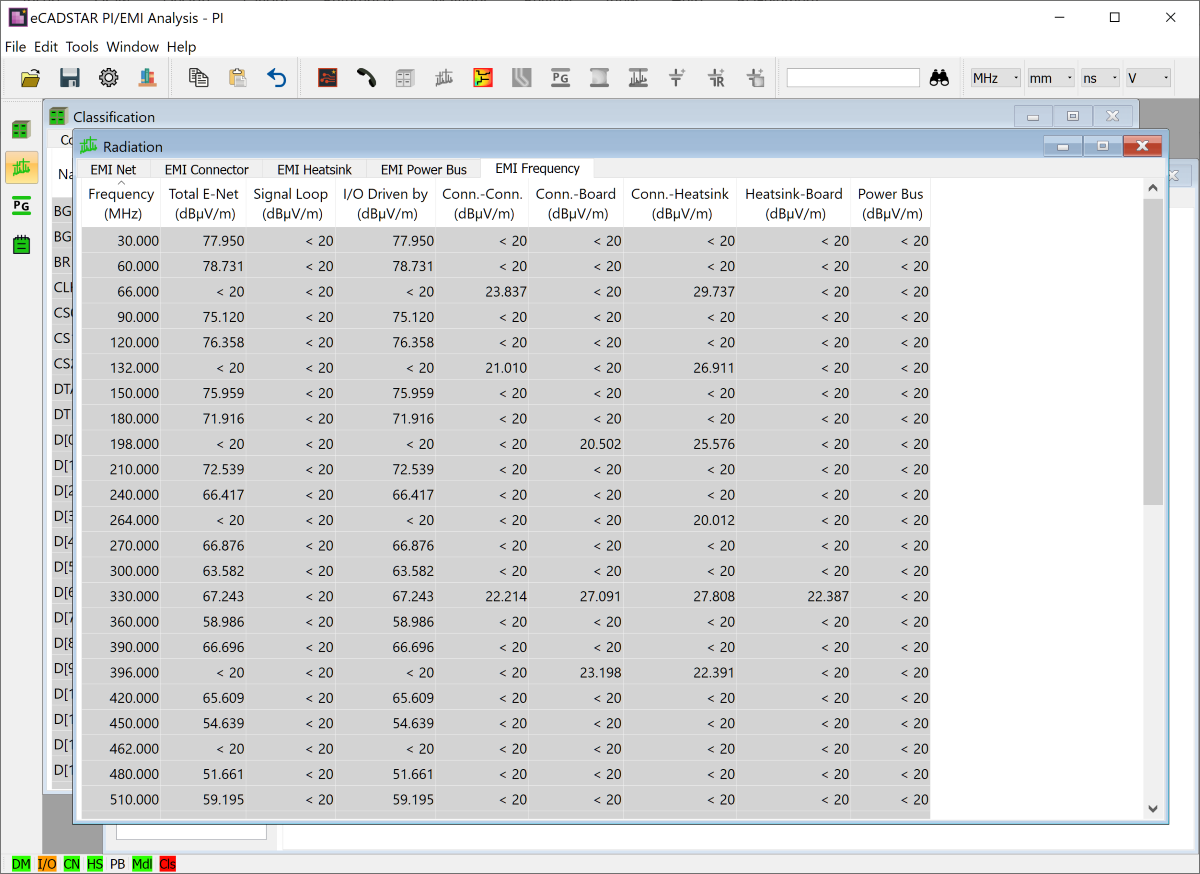
- The vertical axis shows the frequency bands.
- The Total E-Net column shows results for the entire board.
- The other cells show the result for each EMI factor.
- Values shown are peak values.
- To display the results as a spectrum, click Total Radiation Spectrum on the assist menu for the 66 MHz Frequency cell. The eCADSTAR Analysis Results Viewer dialog is displayed. This shows the Total Radiation Spectrum Result.
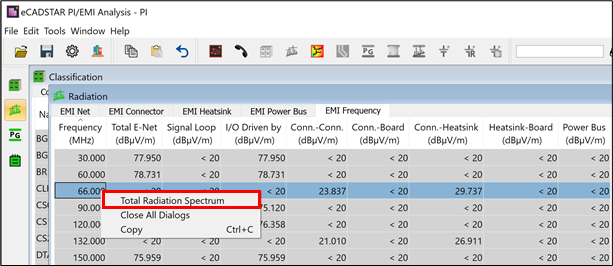
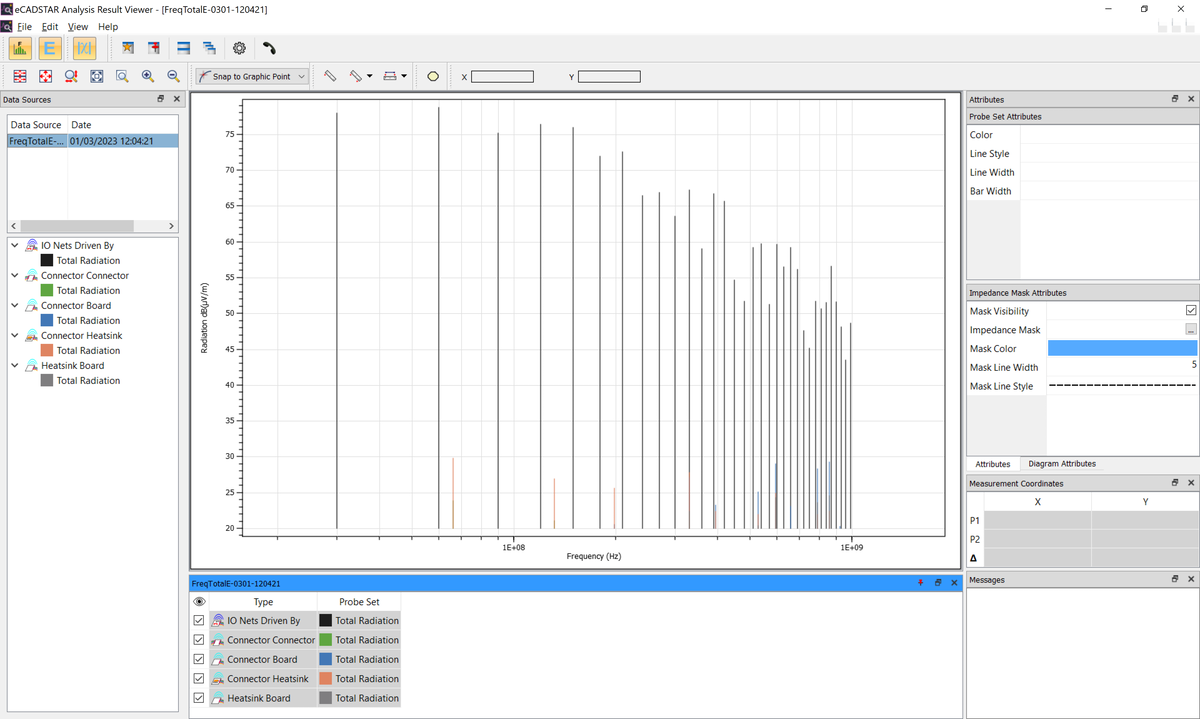
A different color is assigned to each EMI factor in the spectrum graph. The results for each factor are displayed or hidden by clicking the item in the explanatory note.
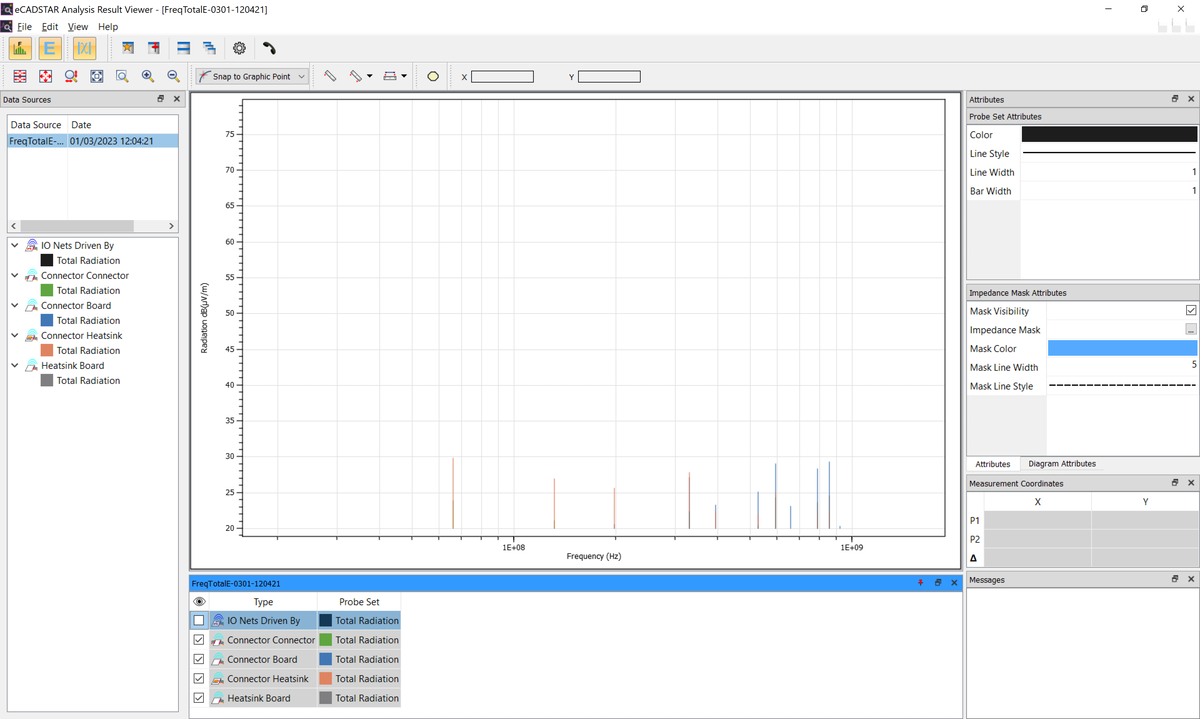
- From the Probe Set list in the eCADSTAR Analysis Result Viewer dialog, deselect the check box for IO Nets Driven By. The impact of I/O coupling noise is excluded from the result. The difference between two graphs indicates that I/O coupling noise has a significant impact, and is therefore the main factor causing radiation in this case.
- Select File > Exit to close Analysis Results Viewer.
This task is demonstrated in the following video.
