
Introduction to Analysis Result Viewer
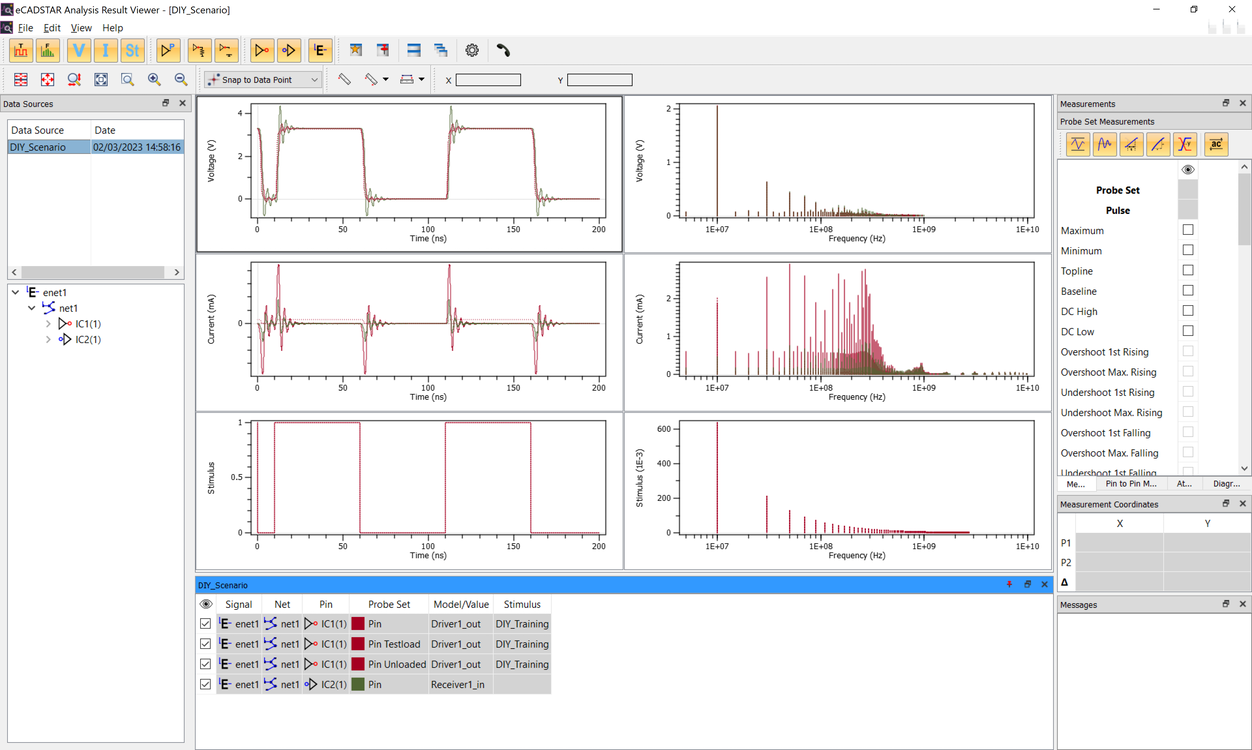
Analysis Result Viewer is a tool for viewing resulting waveforms and measurements obtained from SI Analyses. When you perform SI Analysis in eCADSTAR or Electrical Editor, the Analysis Result Viewer starts, and displays signal waveforms. The results of the SI Analysis are saved in the analysis results file (srdb). In Analysis Result Viewer, you can open existing analysis results files to check previous analysis results.
| Menu | Functions for the application |
|---|---|
| Toolbar | The toolbar contains frequently used commands. |
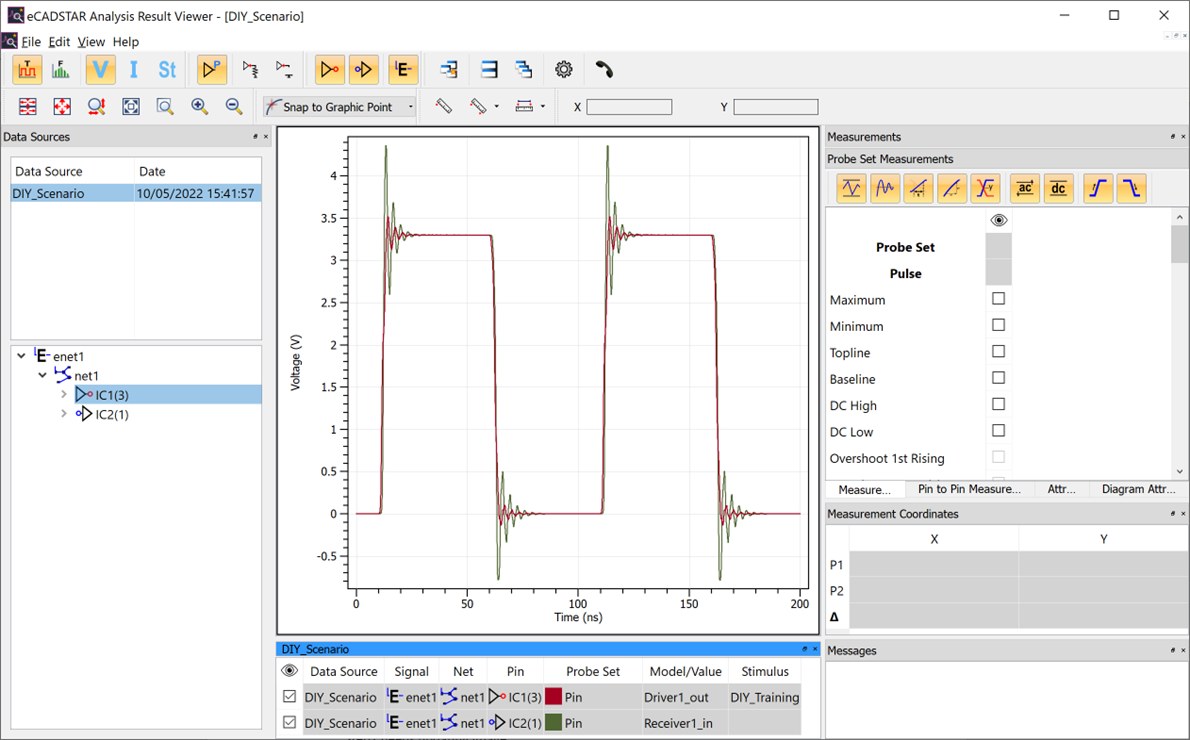
| Data Resource Area | The data sources area has two sections: data source list and data source tree. Details of the selected data source are displayed in the data tree. |
| Chart Area | In the chart area, you can use “Tile” or “Cascade” options to view multiple work sets simultaneously. |
| Working Set Area | Shows the details of the probe sets. |
| Others | Used to edit attributes or to view automated measurement results.
The following types are available:
|
Analysis Result Viewer behaves in a different way in each of the following modes.
- Time Domain Mode
- Frequency Domain Mode
- Eye pattern Mode
The operation mode differs depending on the type of data contained in the analysis result file. Valid toolbar icons, data source structure, and work set operations are different for each mode. However, the operation of basic components such as toolbars and menus are common to all modes.
Opening Analysis Results
Start Analysis Result Viewer, and check the analysis results as follows.
- From the Start menu, click eCADSTAR [Version] > [Analysis Results Viewer [Version]. eCADSTAR Analysis Result Viewer is launched.
- On the menu, click File > Open. An open file dialog is displayed. Browse to the following location “C:\Users\Public\eCADSTAR\eCADSTAR [Version]\SI\DIY_Scenario”, and open the DIY_Scenario.srdb file. This contains analysis results created from a previous training task.
- Select the filters on the toolbar as shown below to configure the views in the chart area of the dialog.

The combined use of filters on the toolbar allows you to control the views of waveforms or charts that you want to refer to. For information about the Analysis Result Viewer toolbar, see the eCADSTAR Online Help, Analysis Result Viewer: Toolbars topic.
This task is demonstrated in the following video.
