
Task 13: Using the Parameter Sweep
- Continuing from the previous task, set the selection filter in the Status Bar to Main Object and select the resistor R1 on the schematic canvas.
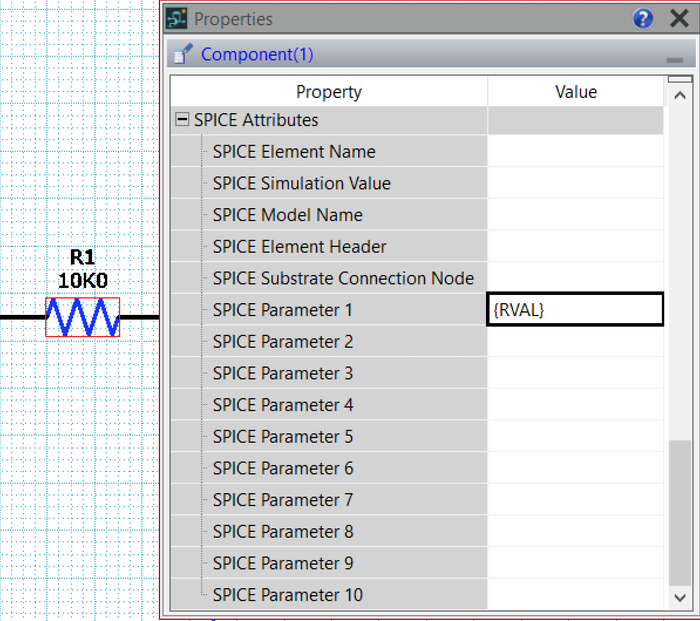
- With R1 selected, open the Properties panel and type "{RVAL}" for the SPICE Parameter 1 property. This assigns the variable value RVAL to the schematic, and allows the value to change for the parameter sweep.
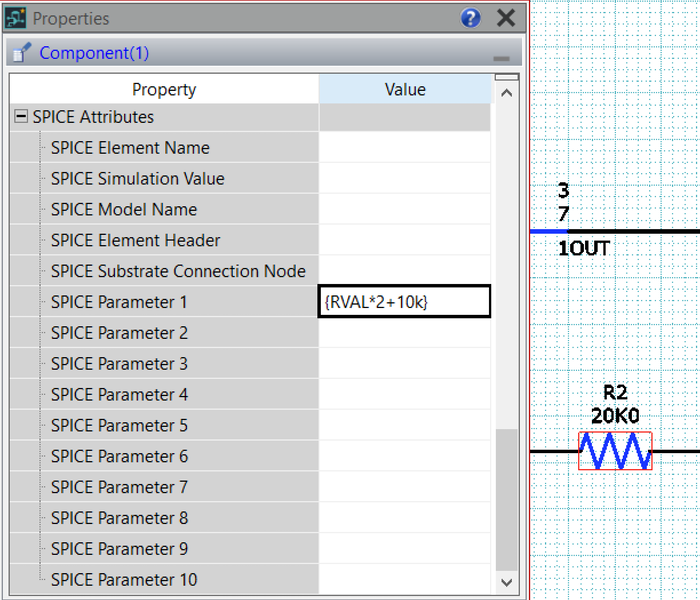
- Select R2 from the canvas, and type "{RVAL*2+10k}" for the same property SPICE Parameter 1. This assigns the equation, and uses the variable resistance value of R1 to calculate the resistance of R2.
When defining variables in the SPICE parameter fields of the properties, they must be within curly { } brackets to be recognized by the LTspice application.
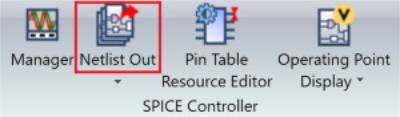
- In the Analysis tab, SPICE Controller group, select Netlist Out.
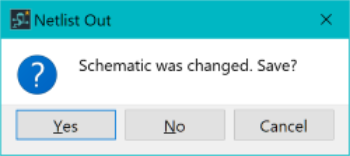
- When prompted, click Yes to save the schematic design. This is required as you have changed a SPICE parameter, and must therefore update the netlist that is supplied for SPICE Controller.
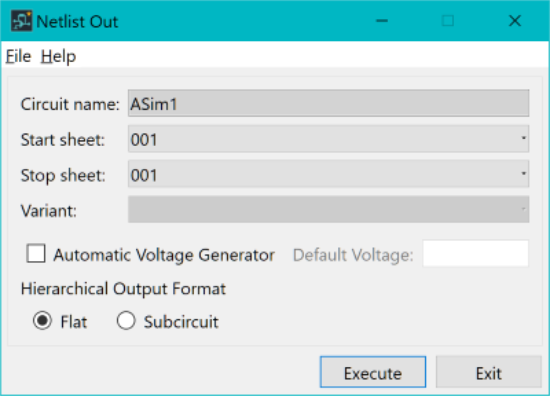
- Confirm that the Netlist Out dialog looks like the image, and then click Execute. A new netlist is created.
- Click OK in the information dialog.
- The SPICE Controller Manager dialog launches automatically after confirmation of the netlist output.
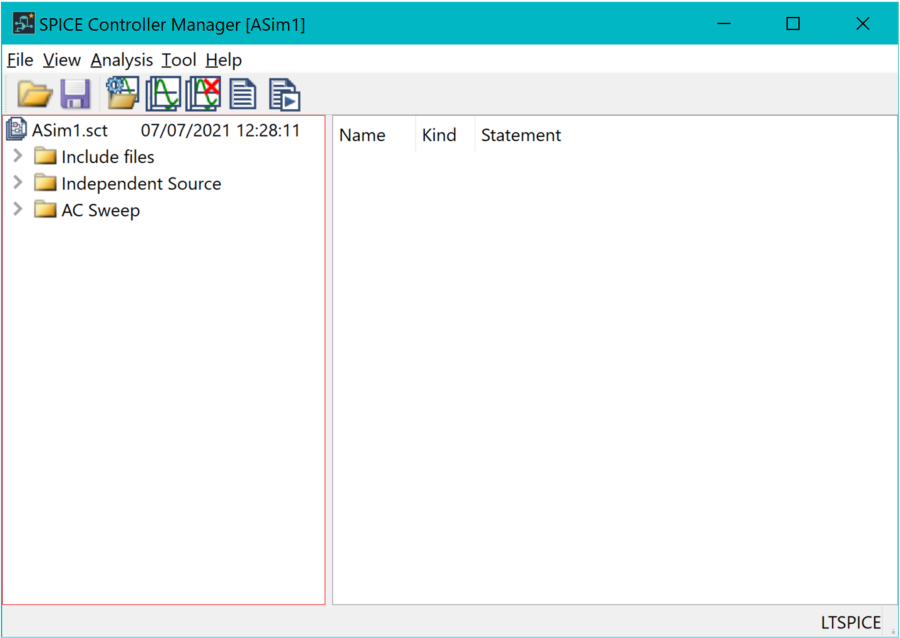
If SPICE Controller Manager is not launched automatically, then launch it by selecting Manager on the Analysis tab, SPICE Controller group.
- In SPICE Controller Manager,
click Analysis Settings
 and select the existing
Transient Analysis setting.
and select the existing
Transient Analysis setting.
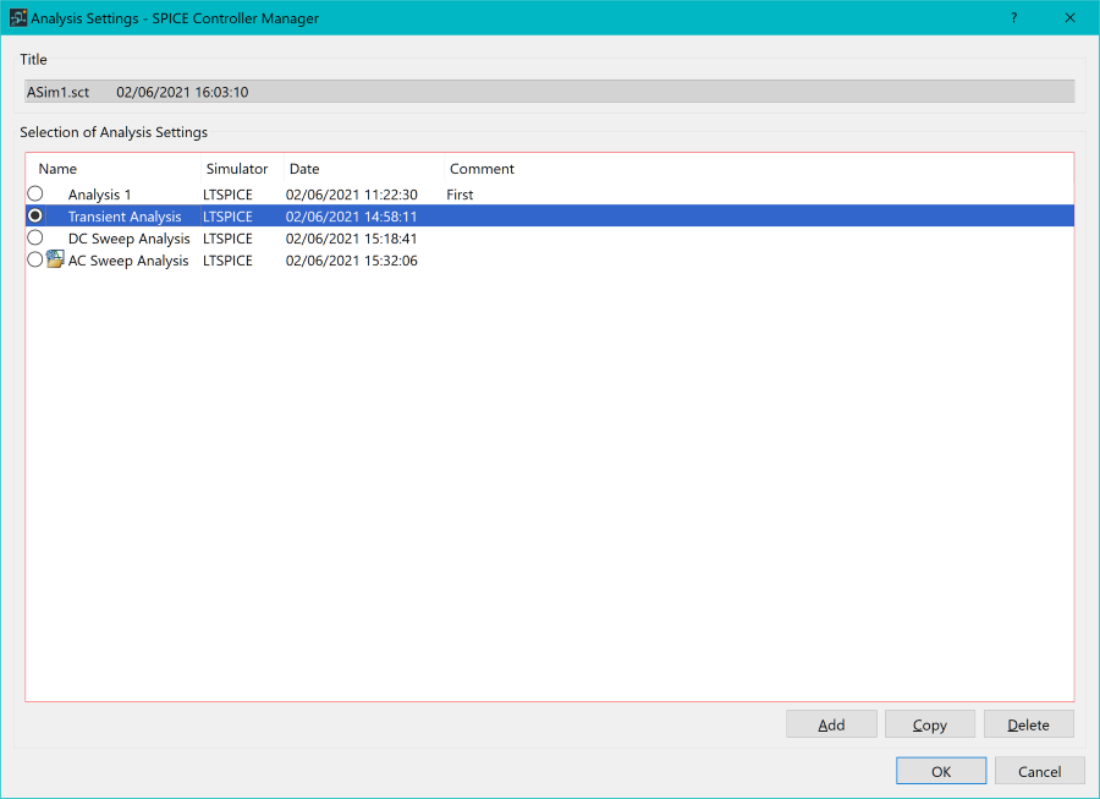
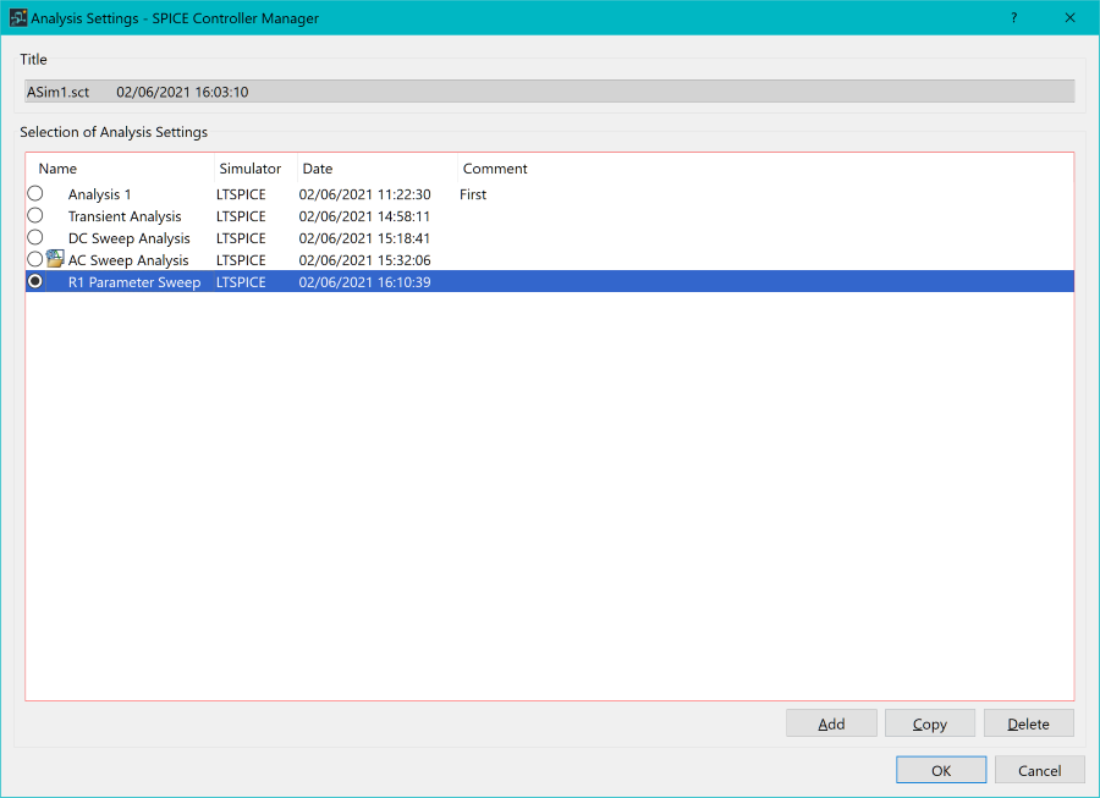
- Select Copy to create a new row, and rename it to "R1 Parameter Sweep".
- Ensure that the radio button for this is selected, and click OK to return to SPICE Controller Manager.
- On the SPICE Controller
Manager ribbon, click Insert Analysis
Condition
 . The
Analysis Condition dialog is displayed.
. The
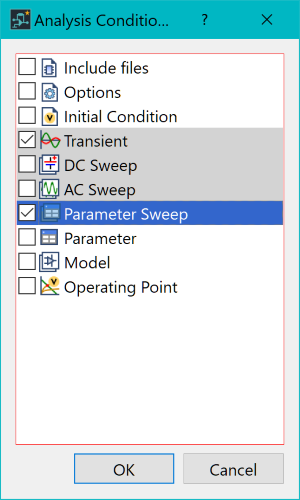
Analysis Condition dialog is displayed. - In the Analysis Conditions dialog, select Parameter Sweep and click OK.
The Transient option is also selected as part of the analysis settings that are saved in earlier tasks.
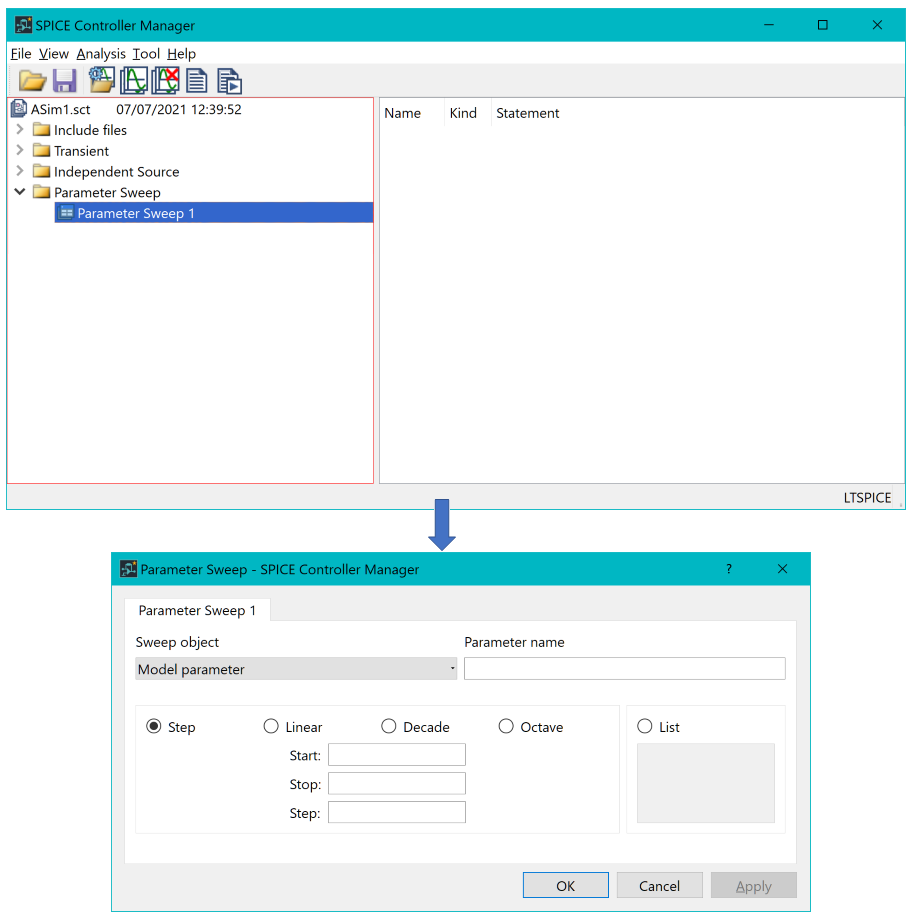
- In SPICE Controller Manager, double-click Parameter Sweep 1. The Parameter Sweep Analysis Condition dialog is displayed.
- In the dialog, specify the following settings.
- Sweep Object: Global Parameter
- Parameter Name: RVAL
- Type: Step
- Start: 1K
- Stop: 10K
- Step: 1K
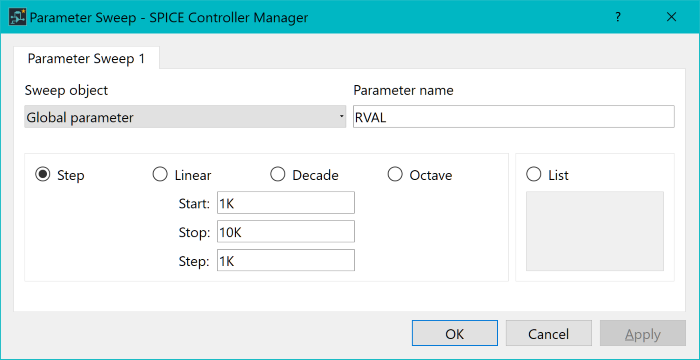
- Click OK to apply the settings and close the dialog.
- On the SPICE Controller
Manager ribbon, click Save
 to save the current data.
 - On the ribbon, click Net
Output, Simulation
 .
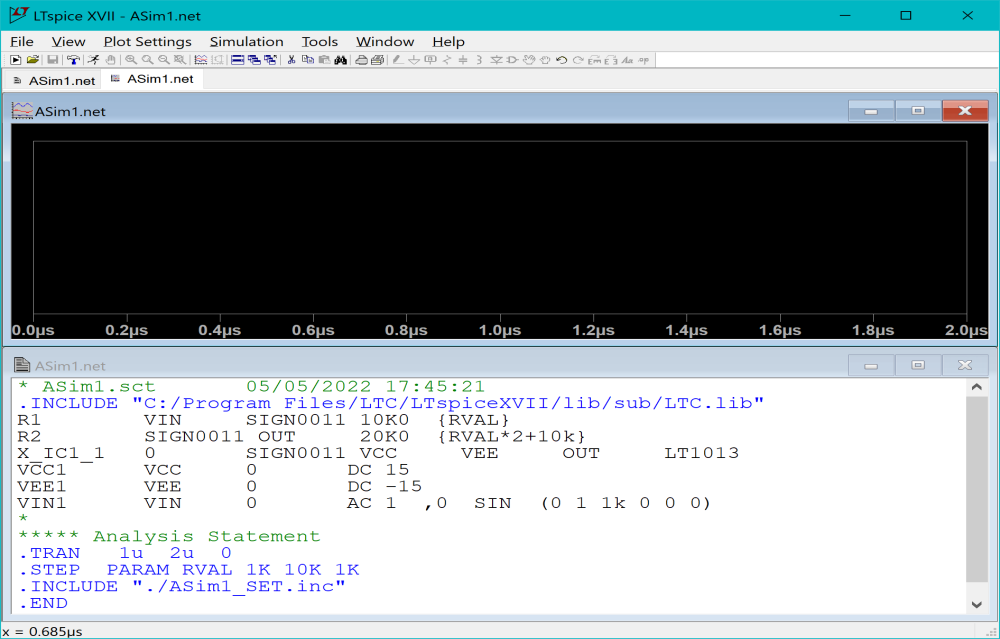
This outputs an updated SPICE netlist and launches LTspice. A simulation
is performed using the data from eCADSTAR
SPICE Controller.
.
This outputs an updated SPICE netlist and launches LTspice. A simulation
is performed using the data from eCADSTAR
SPICE Controller.
The LTspice application may open with no items selected or displayed.
- In the LTspice application, click Plot Settings on the ribbon, and select Visible Traces.
- In the Visible Traces dialog, select the signals V(out) and V(vin), and click OK.
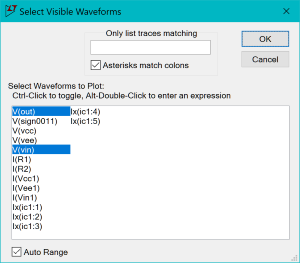
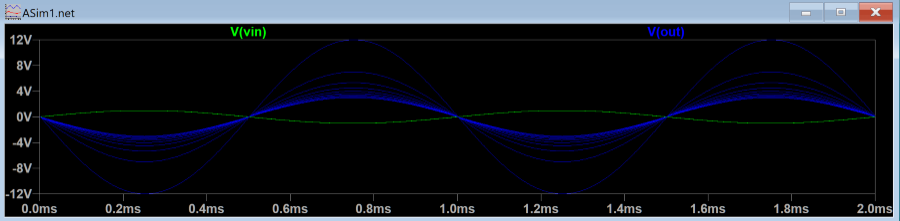
- After clicking OK, the signal is shown on the graph.
- In the LTspice application, click Plot Settings on the ribbon and click Select Steps. This allows you to display each step individually on the canvas, when analyzing the results.
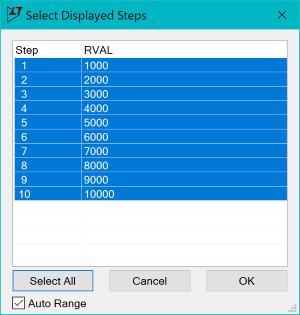
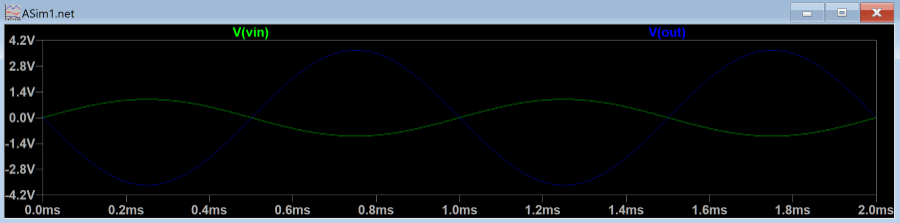
- Select the row Step: 6 and RVAL: 6000, and click OK. The displayed graph is updated to show only a single V(out) waveform.
- Close the LTspice application and SPICE Controller Manager.
- In eCADSTAR Schematic Editor, select File > Close Design to close the schematic design.
