
Task 5: Performing SI Analysis
This topic describes how to perform SI analysis on signals, using Analysis Result Viewer to check the resulting waveforms.
- From the Constraint Browser tree view, select differential pair "DDR_DQS0_N-DDR_DQS0_P".
- On the menu select Utility > Extract Scenario to launch eCADSTAR Electrical Editor with the extracted topology of the differential pair signal.
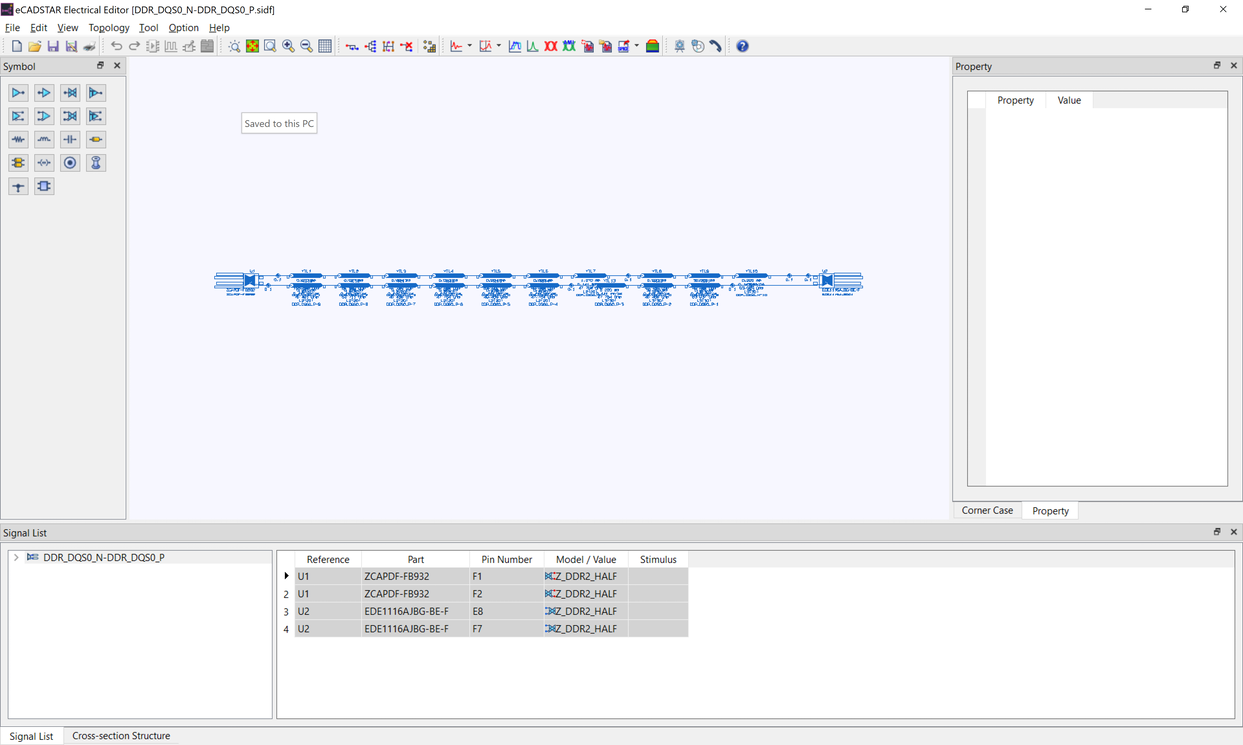
Based on the coupling criteria, the topologies of the signals that act as an aggressor are also displayed.
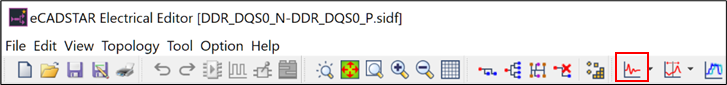
- On the toolbar, click
 SI Analysis.
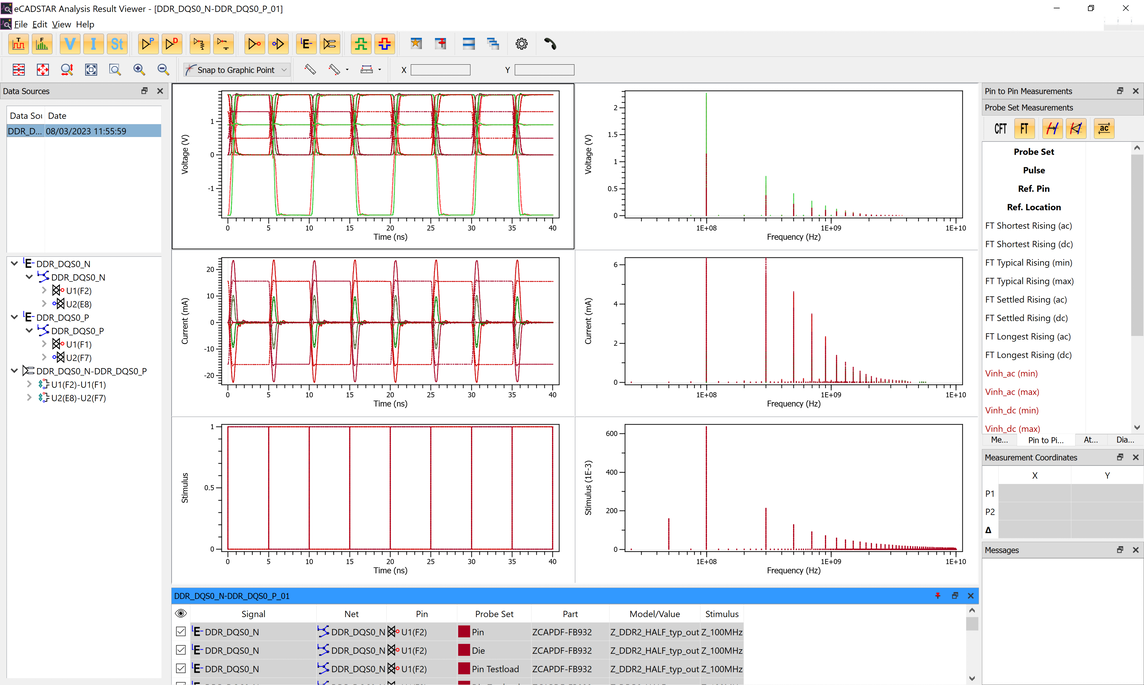
Analysis Result Viewer is launched, and displays the resulting waveforms.
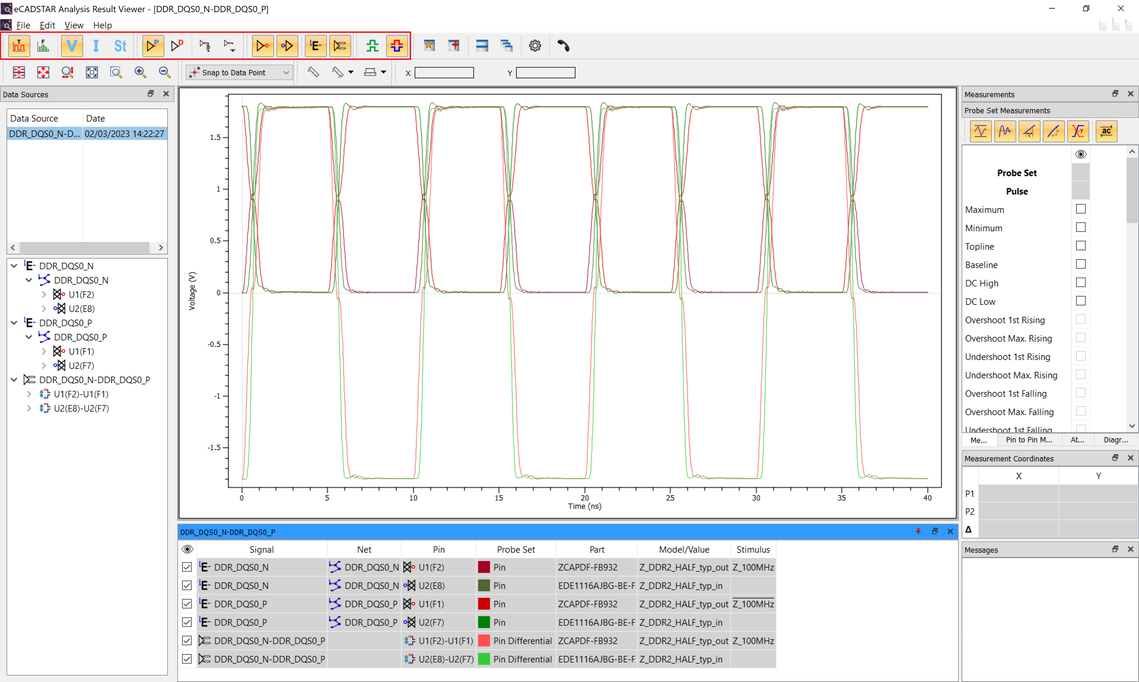
On the Analysis Result Viewer toolbar, set the filters as shown below. These control the views in the chart area. These settings are used throughout the Signal Integrity training.

| Icon | Description |
|---|---|
 Time
Domain Waveforms Display Filter Time
Domain Waveforms Display Filter |
Toggles the display of all the Time Domain based Graphs from the Analysis Results Viewer Layout. |
 Frequency
Domain Waveforms Display Filter Frequency
Domain Waveforms Display Filter |
Toggles the display of all the Frequency Domain based Graphs from the Analysis Results Viewer Layout. |
 Voltage
Waveform Display Filter Voltage
Waveform Display Filter |
Toggles the display of both Time Domain and Frequency Domain Voltage Graphs from the Analysis Results Viewer Layout. |
 Current
Waveform Display Filter Current
Waveform Display Filter |
Toggles the display of both Time Domain and Frequency Domain Current Graphs from the Analysis Results Viewer Layout. |
 Stimulus
Waveform Display Filter Stimulus
Waveform Display Filter |
Toggles the display of both Time Domain and Frequency Domain Stimulus Graphs from the Analysis Results Viewer Layout. |
 Pin
Level Waveform Display Filter Pin
Level Waveform Display Filter |
Toggles all Pin Level Waveforms from the Time and Frequency Domain Graphs for Voltage, Current and Stimulus and Pin Details from the Probe Set List. |
 Die
Level Waveform Display Filter Die
Level Waveform Display Filter |
Toggles all Die Level Waveforms from the Time and Frequency Domain Graphs for Voltage, Current and Stimulus and Pin Details from the Probe Set List. |
 Testload
Waveform Display Filter Testload
Waveform Display Filter |
Toggles all Testload Waveforms from the Time and Frequency Domain Graphs for Voltage, Current and Stimulus and Testload Details from the Probe Set List. |
 Unloaded
Waveform Display Filter Unloaded
Waveform Display Filter |
Toggles all Unloaded Waveforms from the Time and Frequency Domain Graphs for Voltage, Current and Stimulus and Unloaded Details from the Probe Set List. |
 Driver
Waveform Display Filter Driver
Waveform Display Filter |
Toggles all Driver Waveforms from the Time and Frequency Domain Graphs for Voltage, Current and Stimulus and Driver Details from the Probe Set List. Note: The Stimulus Waveforms for Time and Frequency Domain Graphs will be removed from the Analysis Results Viewer Layout. |
 Receiver
Waveform Display Filter Receiver
Waveform Display Filter |
Toggles all Receiver Waveforms from the Time and Frequency Domain Graphs for Voltage, and Current and Receiver Details from the Probe Set List. |
 E-Net
Waveform Display Filter E-Net
Waveform Display Filter |
Toggles all E-Net Waveforms from the Time and Frequency Domain Graphs for Voltage, Current and Stimulus and E-Net Details from the Probe Set List. Note: The Stimulus and Current Waveforms for Time and Frequency Domain Graphs will be removed from the Analysis Results Viewer Layout. |
 Differential
Pair Waveform Display Filter Differential
Pair Waveform Display Filter |
Toggles all Differential Pair Waveforms from the Time and Frequency Domain Graphs for Voltage and Differential Pair Details from the Probe Set List. |
 Common
Mode Waveform Display Filter Common
Mode Waveform Display Filter |
Toggles all Common Mode Waveforms from the Time and Frequency Domain Graphs for Voltage and Common Mode Details from the Probe Set List. |
 Differential
Mode Waveform Display Filter Differential
Mode Waveform Display Filter |
Toggles all Differential Mode Waveforms from the Time and Frequency Domain Graphs for Voltage and Differential Mode Details from the Probe Set List. |
As a result of these filter changes, the Time Domain Voltage graphs are displayed for Driver and Receivers for the Differential Pair signal "DDR_DQS0_N-DDR_DQS0_P", and the E-Net signals of each half of the Differential Pair.
- On the menu bar, click File > Exit to close Analysis Result Viewer.
SI analysis can be performed from the following areas of eCADSTAR.
- On the canvas: select the target signal on the canvas, and then click Analysis > SI > SI Analysis on the ribbon.
- In Constraint Browser: select the signal to be analyzed in the tree, and then click SI Analysis on the Utility menu in Constraint Browser.
- In Electrical Editor: after viewing the topology
of the target signal, click SI Analysis
on the Tool menu in Electrical Editor.
This task is demonstrated in the following video.
