
Task 9: Creating a Transient Analysis
- Continuing from the previous task, in SPICE
Controller Manager, click Analysis
Settings
 on
the ribbon. The Analysis Settings dialog
is displayed.
on
the ribbon. The Analysis Settings dialog
is displayed.
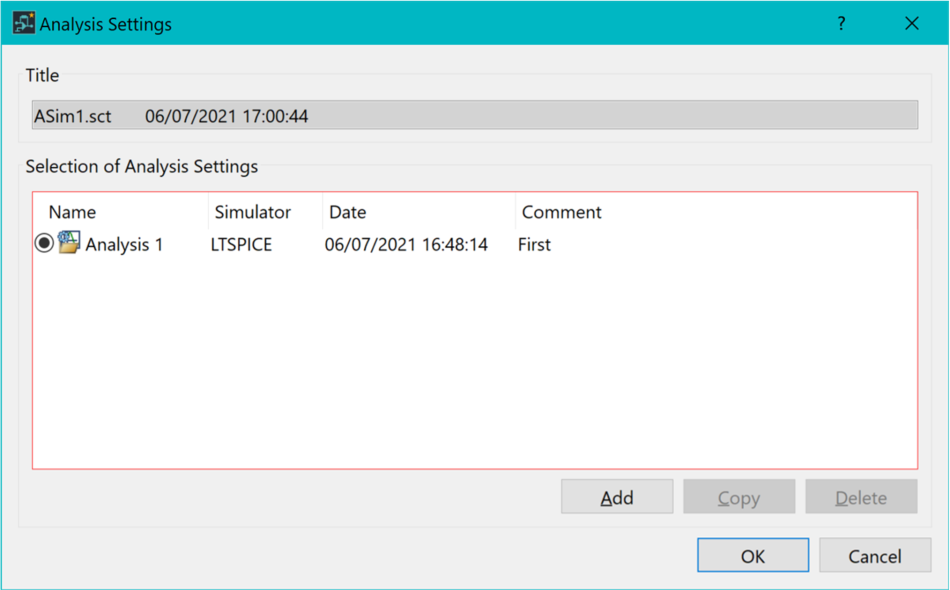
- In the dialog, select the "Analysis 1" row and click Copy. This will add a new row in the table, copying all the contents.
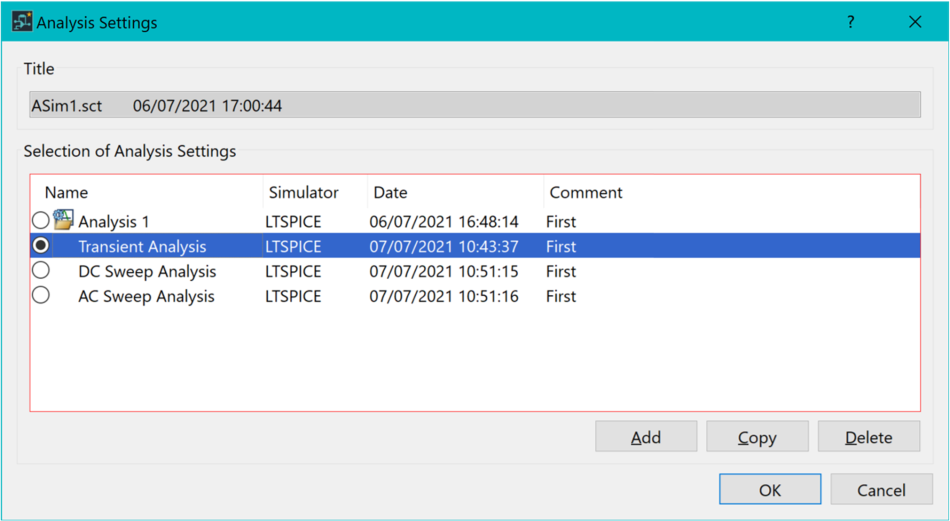
- Rename this row to "Transient Analysis".
- In the dialog, select the "Analysis 1" row and add two more rows using the Copy command. Name them "DC Sweep Analysis" and "AC Sweep Analysis", respectively.
- Ensure Transient Analysis is selected, and click OK to exit the dialog.
- A Save prompt is displayed. Click Yes to save the analysis settings.
- On the SPICE Controller
Manager ribbon, click Insert Analysis
Condition
 . The
Analysis Condition dialog is displayed.
. The
Analysis Condition dialog is displayed.
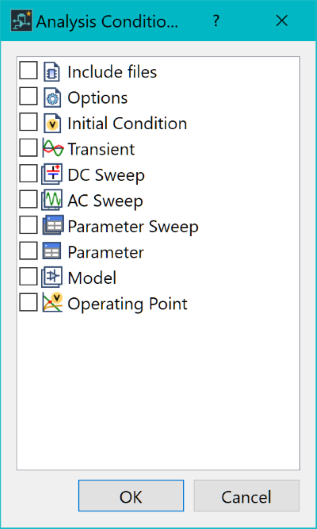
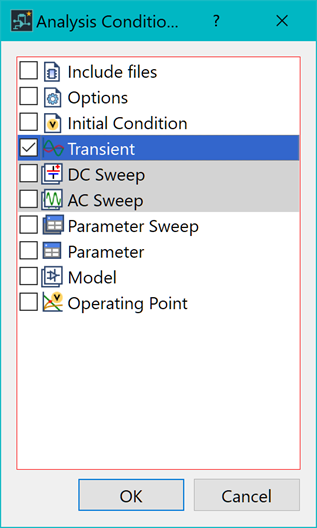
- In the Insert Analysis Conditions dialog, select Transient and click OK.
- In SPICE Controller Manager, double-click "Transient 1". The Transient - SPICE Controller Manager dialog is displayed.
![]()

- In the dialog, specify the following.
- Stop time: 2m ( representing 2 milliseconds ).
- Print step: 1u ( representing 1 microsecond ).
- Time to start saving data: 0 ( data is saved from the start of the recording).
- Click OK to apply the settings and close the dialog.
- On the SPICE Controller
Manager ribbon, click Save
 to save the current data.
 - On the ribbon, click Net
Output, Simulation
 .
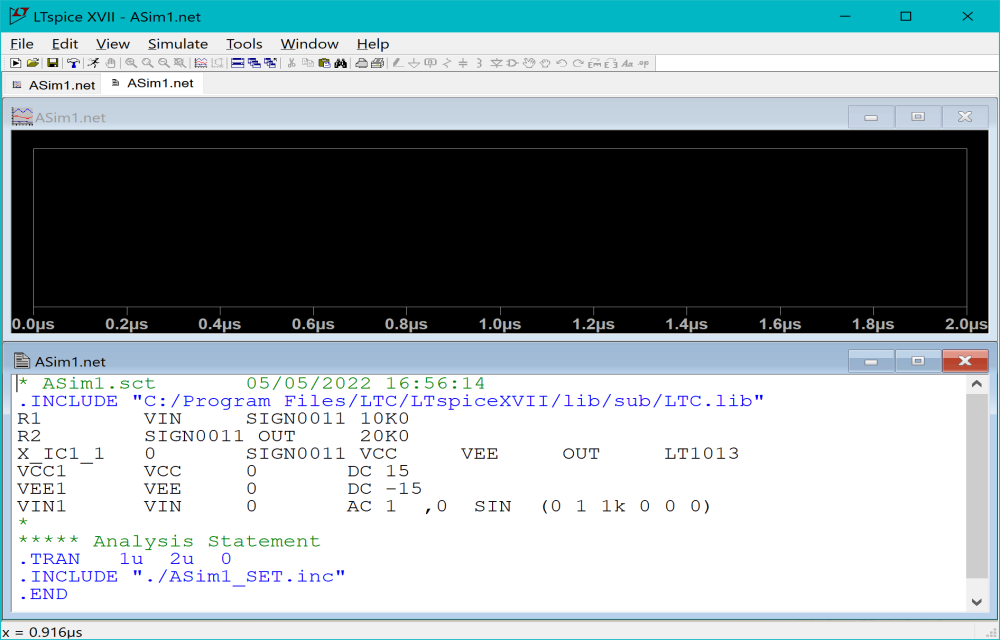
This outputs an updated SPICE netlist. LTspice launches, and performs
a simulation using the data from eCADSTAR
SPICE Controller.
.
This outputs an updated SPICE netlist. LTspice launches, and performs
a simulation using the data from eCADSTAR
SPICE Controller.
Note
The LTspice application may open with no items selected or displayed.
 .
.
The LTspice application may open with no items selected or displayed.
.
- Within the LTspice application, click Plot Settings on the ribbon and select Visible Traces.
- In the Visible Traces dialog, Select signals V(vin) and V(out) using the Ctrl key. When selected, click OK.
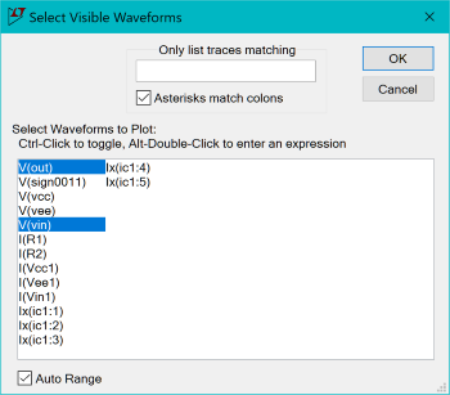
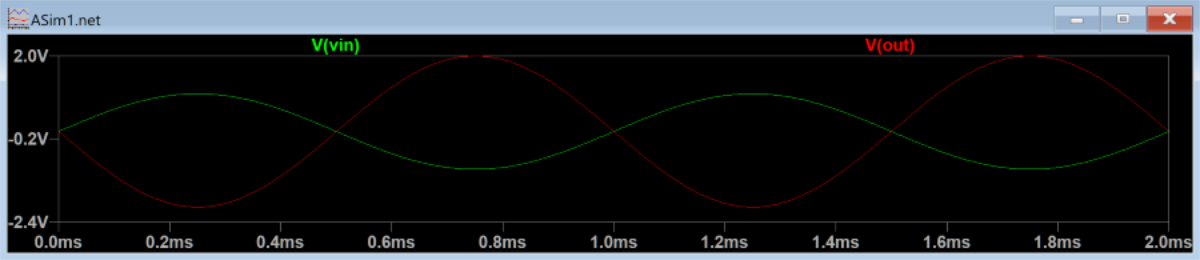
- After clicking OK, the signals are shown on the graph.
Note
In the transient characteristics, time variation is represented on the x-axis. A 1KHz sine wave with an input signal of 1V is amplified to 2V, represented by the V(out) waveform.
In the transient characteristics, time variation is represented on the x-axis. A 1KHz sine wave with an input signal of 1V is amplified to 2V, represented by the V(out) waveform.
- Close the LTspice application and return to SPICE Controller Manager.
