
Task 10: Creating a DC Sweep Analysis
- Continuing from the previous task, click Analysis Settings
 in
SPICE Controller Manager.
in
SPICE Controller Manager. - Select DC sweep Analysis, and click OK.
- On the SPICE Controller
Manager ribbon, select Insert Analysis
Condition
 . The
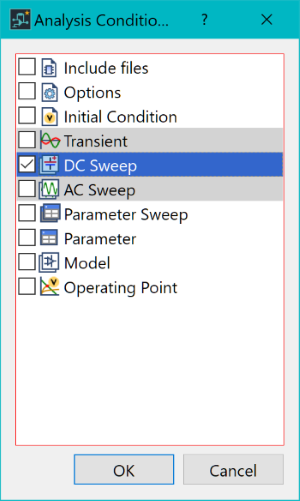
Analysis Condition dialog is displayed.
. The
Analysis Condition dialog is displayed. - In the Analysis Conditions dialog, select DC Sweep and click OK.
- In SPICE Controller Manager, double-click DC Sweep 1. The DC Sweep - SPICE Controller Manager dialog is displayed.
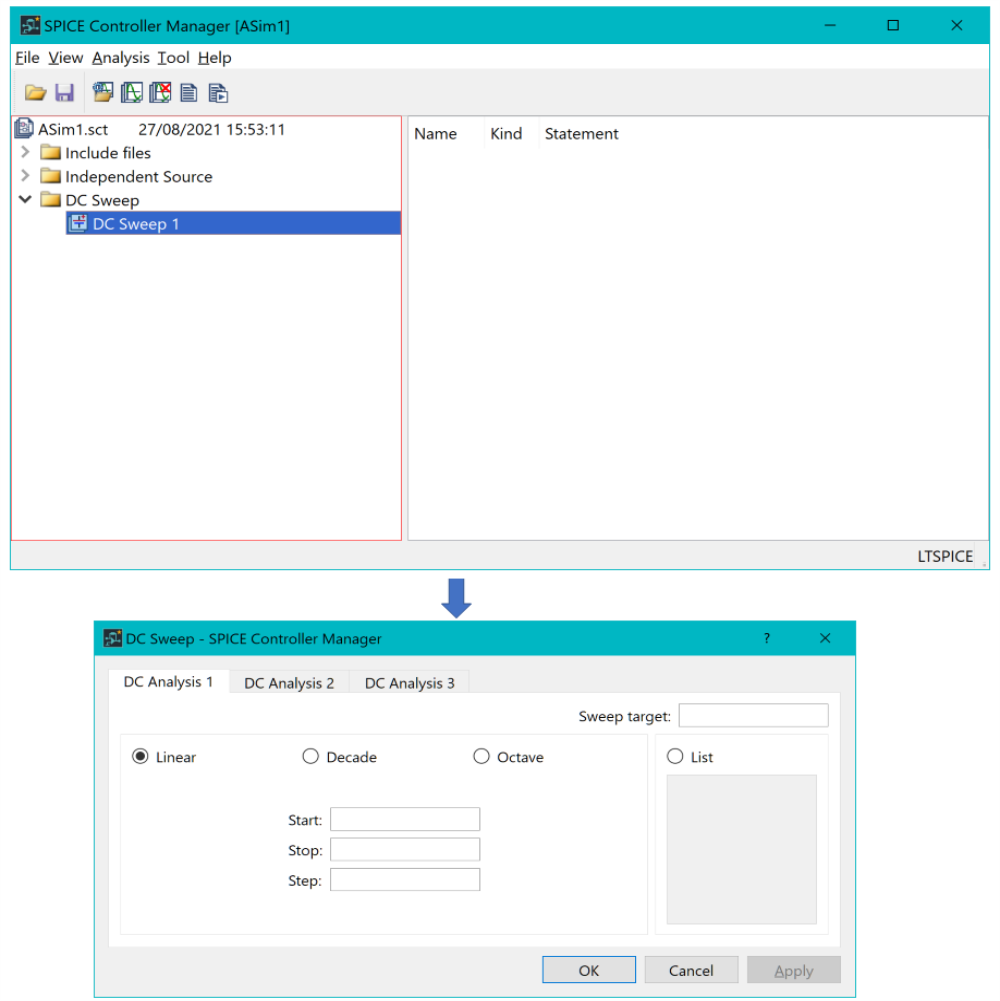
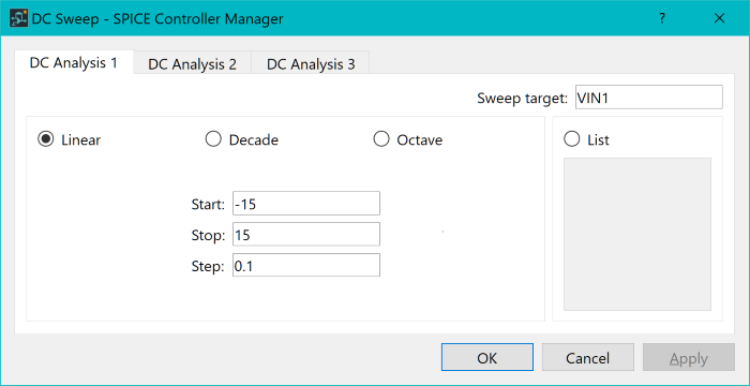
- In the dialog, specify the following.
- DC Analysis type: Linear
- Sweep target : VIN1
- Start: -15 ( -15 Volts)
- Stop: 15 ( 15 Volts)
- Step: 0.1 ( 0.1 Volts)
- Click OK to apply the settings and close the dialog.
- On the SPICE Controller
Manager ribbon, click Save
 to save the current data.
 - On the ribbon, click Net
Output, Simulation
 .
This outputs an updated SPICE netlist. LTspice launches, and performs
simulation using the data in eCADSTAR
SPICE Controller.
.
This outputs an updated SPICE netlist. LTspice launches, and performs
simulation using the data in eCADSTAR
SPICE Controller.
Note
The LTspice application may open with no items selected or displayed.
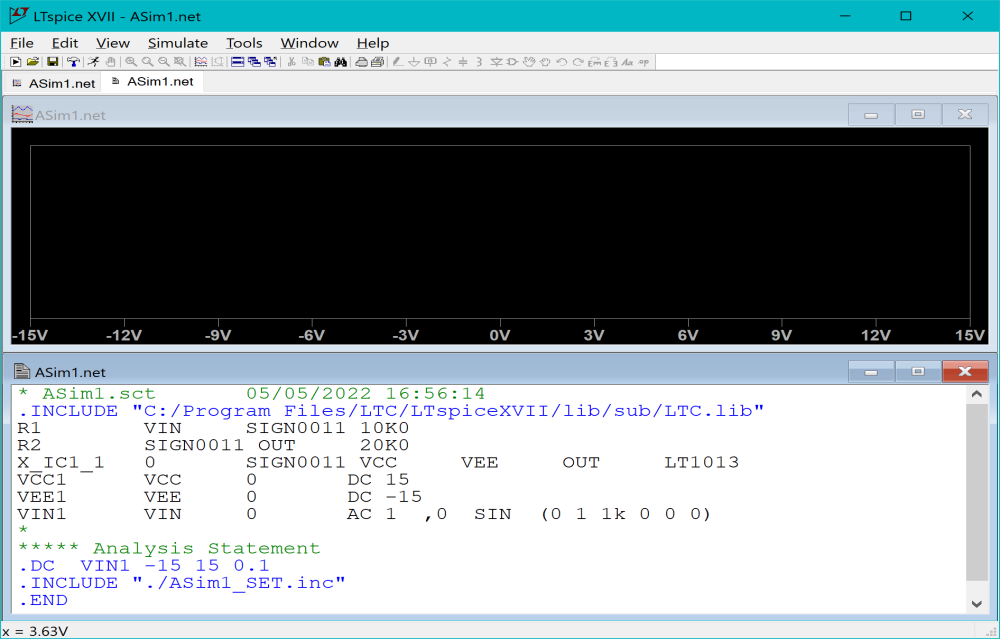
The LTspice application may open with no items selected or displayed.
- In the LTspice application, click Plot Settings on the ribbon and select Visible Traces.
- In the Visible Traces dialog, select the signal V(out) and click OK.
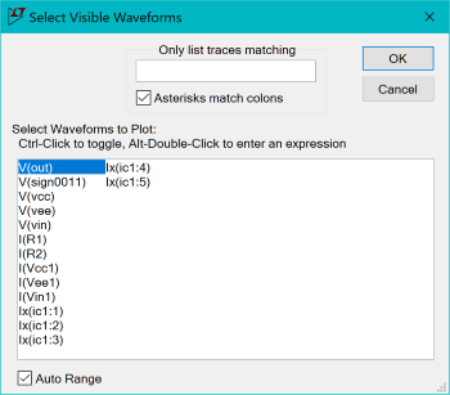
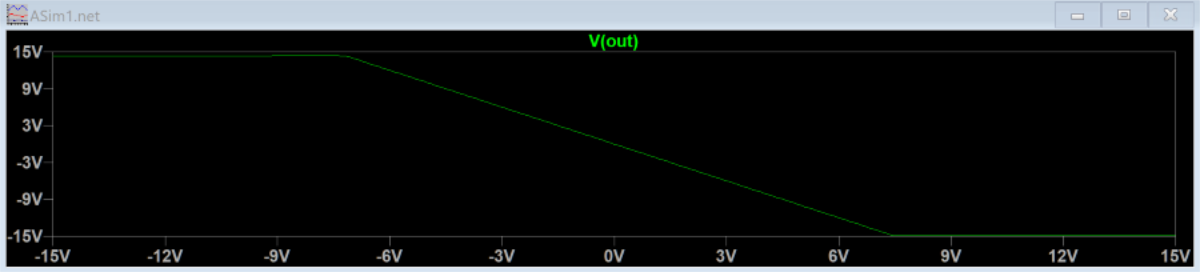
- After you click OK, the signal is shown on the graph.
Note
In principle, static characteristics, where the voltage of the input signal source VIN is shown on the x-axis, has an inclination of -2. Since saturation occurs, the output does not exceed the range of the power voltage of the op-amp.

In principle, static characteristics, where the voltage of the input signal source VIN is shown on the x-axis, has an inclination of -2. Since saturation occurs, the output does not exceed the range of the power voltage of the op-amp.
- Close the LTspice application and return to SPICE Controller Manager.
