
Task 11: Creating an AC Sweep Analysis
- Continuing from the previous task, click Analysis Settings
 in
SPICE Controller Manager.
in
SPICE Controller Manager. - Select AC sweep Analysis and click OK.
- On the SPICE Controller
Manager ribbon, select Insert Analysis
Condition
 . The
Analysis Condition dialog is displayed.
. The
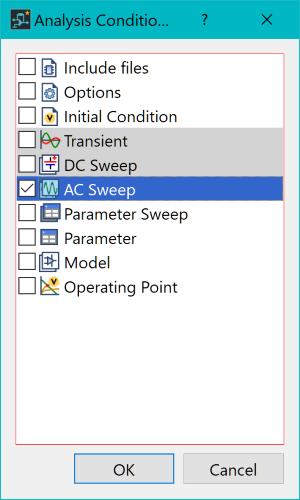
Analysis Condition dialog is displayed. - In the Insert Analysis Conditions dialog, select AC Sweep and click OK.
- In SPICE Controller Manager, double-click AC Sweep 1. The AC Sweep - SPICE Controller Manager dialog is displayed.
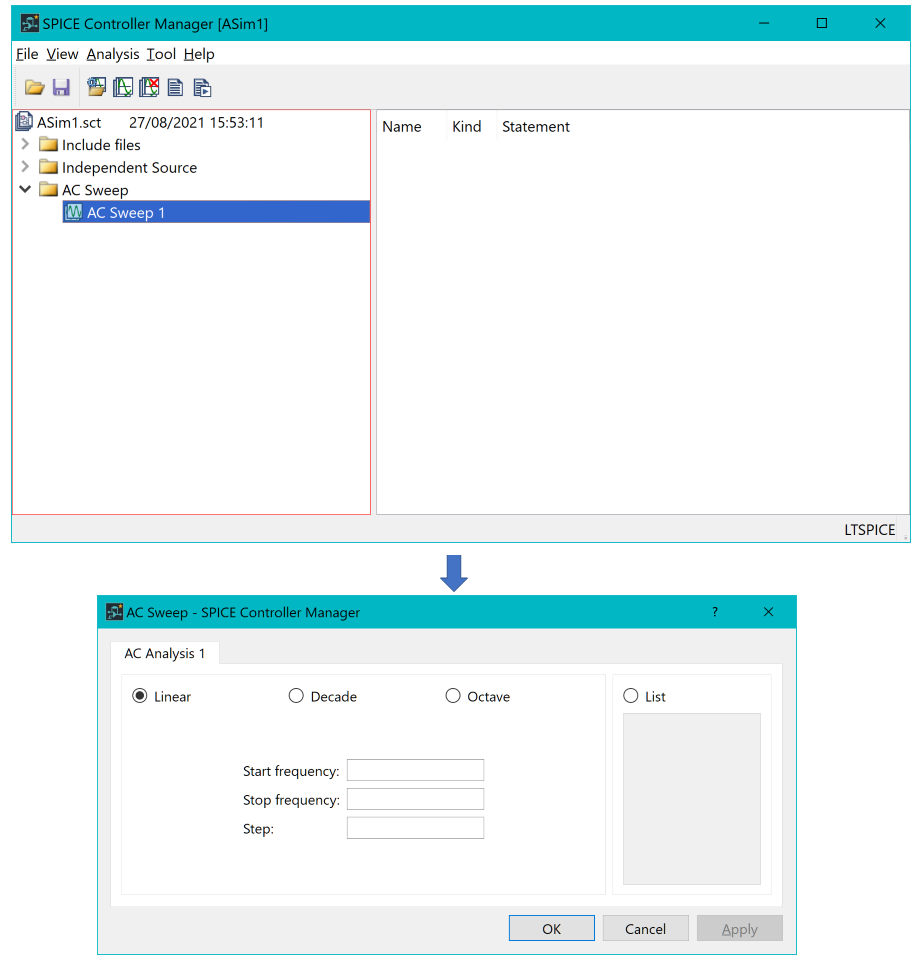
- In the dialog, specify the following.
- Sweep type: Decade
- Start frequency: 1
- Stop frequency: 1meg
- Points per decade: 10
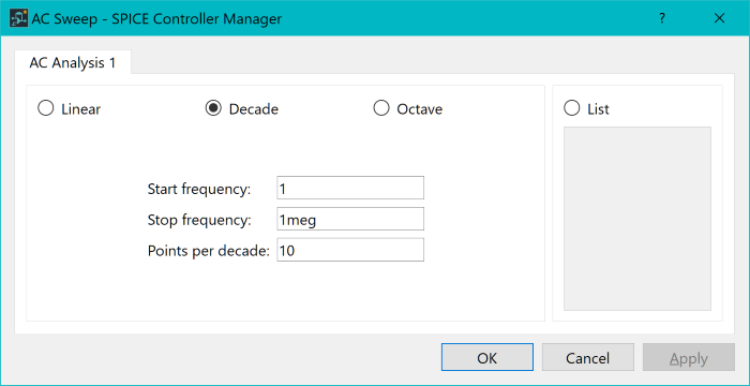
- Click OK to apply the settings and close the dialog.
- On the SPICE Controller
Manager ribbon, click Save
 to save the current data.
 - On the ribbon click Net
Output, Simulation
 .
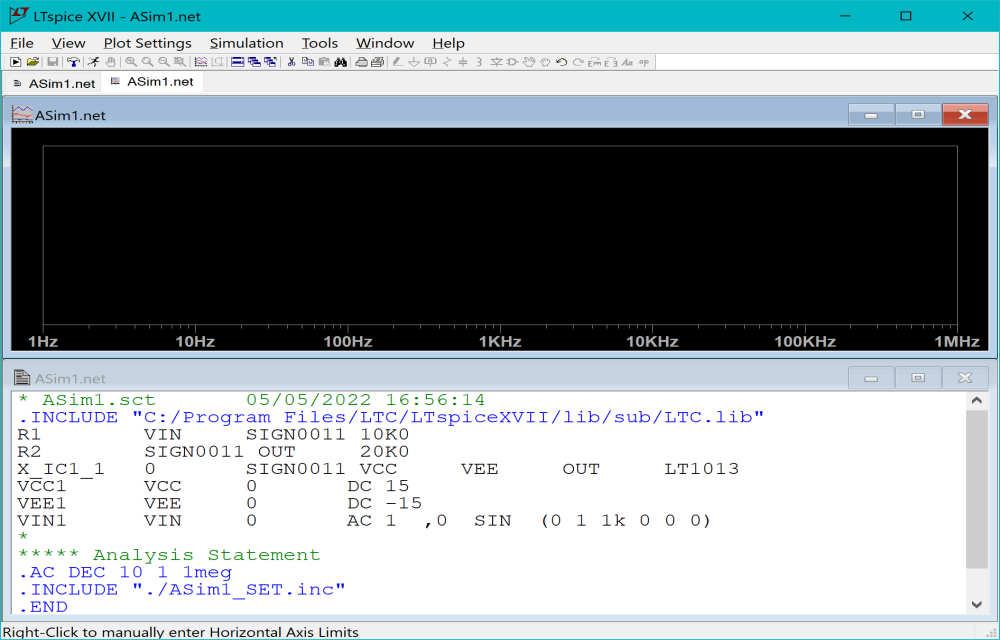
This outputs an updated SPICE netlist. LTspice launches, and performs
a simulation using the data in eCADSTAR
SPICE Controller.
.
This outputs an updated SPICE netlist. LTspice launches, and performs
a simulation using the data in eCADSTAR
SPICE Controller.
Note
The LTspice application may open with no items selected or displayed.
The LTspice application may open with no items selected or displayed.
- In the LTspice application, click Plot Settings on the ribbon and select Visible Traces.
- In the Visible Traces dialog, select the signal V(out) and click OK.
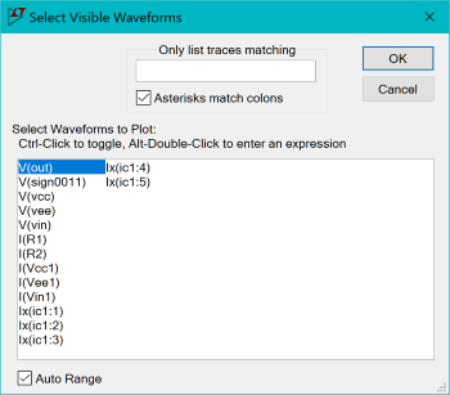
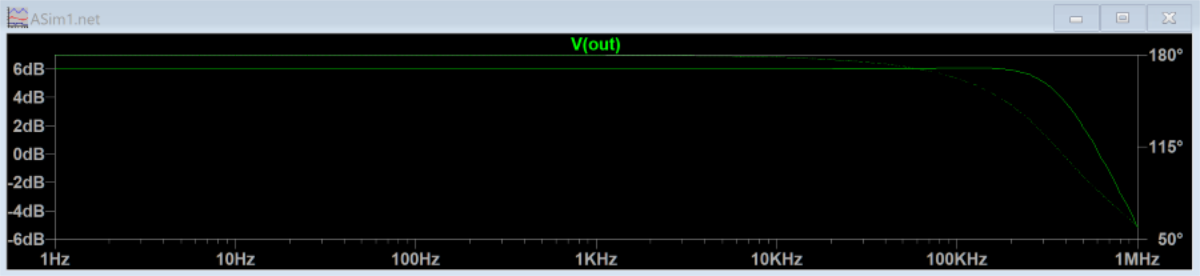
- After clicking OK, the signal is shown on the graph.
Note
In the frequency characteristics, where frequency is shown on the x-axis, the voltage amplification rate drops when the frequency exceeds about 100 kHz, due to the slew rate of the op-amp.
In the frequency characteristics, where frequency is shown on the x-axis, the voltage amplification rate drops when the frequency exceeds about 100 kHz, due to the slew rate of the op-amp.
- Close the LTspice application and SPICE Controller Manager. Return to eCADSTAR Schematic Editor.
