
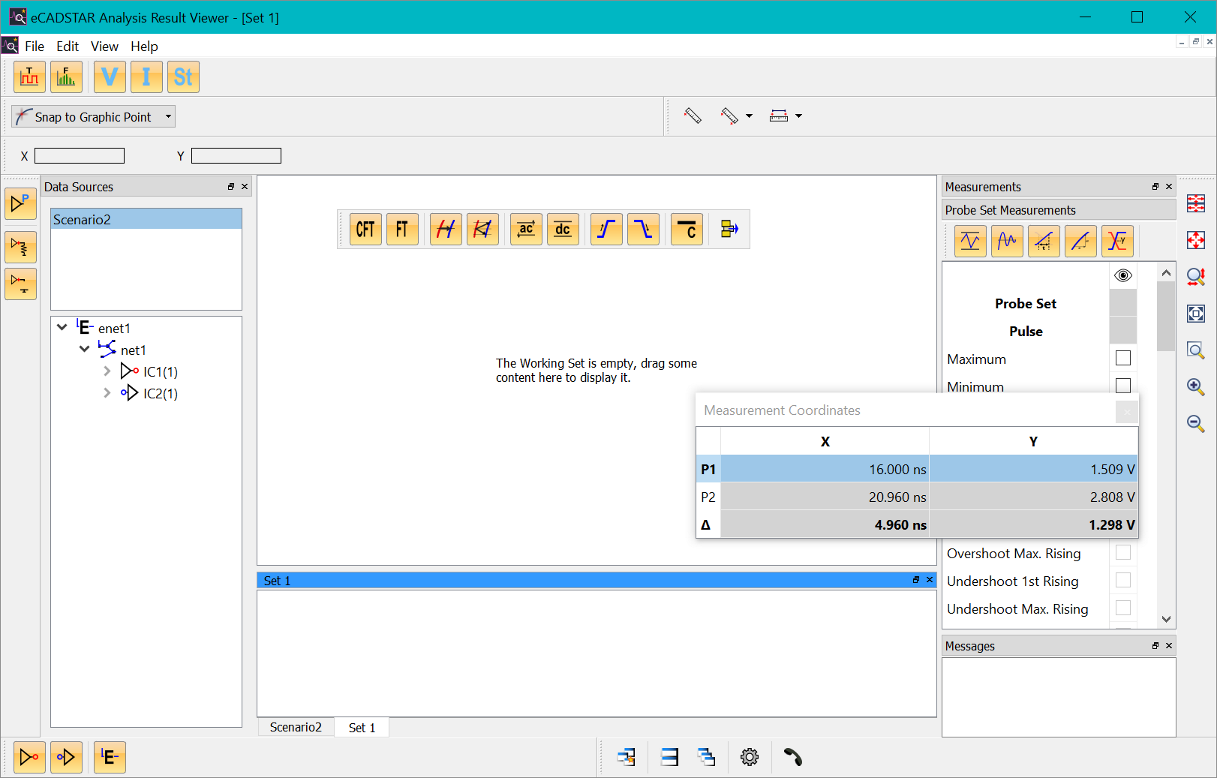
The following toolbars are provided in the Analysis Result Viewer. These allow quick access to important functions. Shortcuts are also described in this topic for commonly-used functions.
For Help on the menus, see: Analysis Result Viewer: Menus.
Toolbar Arrangements
As shown below, the toolbars can be docked in numerous places around the central Chart Window area. They can also be placed inside or outside of the main window.
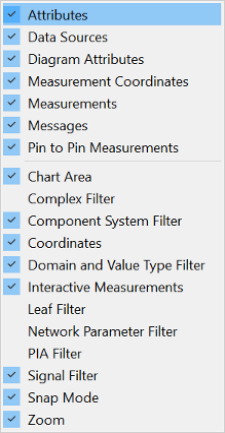
The visibility of the individual toolbars can be controlled by clicking View > Windows and Toolbars on the menu. Alternatively, right-click in the toolbar area to display the assist menu.
Filter Toolbars
The display of waveforms can by controlled using filter buttons. These are grouped into the following filter toolbars. Depending on the operating mode and dataset, a variety of filters are available from the toolbar. These filters allow you to toggle the display of data within the Chart Area and Analysis Results Viewer interface.
The visibility of data also controls the data that is read from the input file. Fewer enabled filters reduce the loading time.
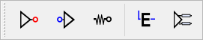
Axis Filter

| Value | Description |
|---|---|
 Time Domain
Visibility Time Domain
Visibility
|
Toggles the display of waveforms in the time domain (for example, v(t)) in the Chart area. |
 Frequency Domain
Visibility Frequency Domain
Visibility
|
Toggles the display of Frequency Domain (for example, V(f)) values in the Chart area. |
 Voltage Voltage
|
Toggles the display of voltage charts in the Chart area. |
 Current Current
|
Toggles the display of current charts in the Chart area. |
 Stimulus Stimulus
|
Toggles the display of stimulus charts in the Chart area. |
 Impedance Impedance |
Toggles the display of a TDR impedance Z(t) charts in the Chart area. |
In the SI Eye Pattern mode and AMI Eye Pattern mode, the following axis filters are available.

| Value | Description |
|---|---|
 Eye Pattern Eye Pattern
|
Toggles the display of Eye Pattern in the Analysis Result Viewer. |
|
Voltage
|
Toggles the display of Voltage charts in the Analysis Result Viewer. |
 Bathtub Curves Bathtub Curves
|
For an AMI Eye Pattern, you can display Bathtub Curves. The Bit Error Rate (BER) is displayed against the bit unit interval. |
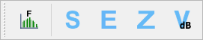
In the S-Parameter and PI and EMI mode, additional axis filters are available. The axis filters that are displayed are dependent on the content of the loaded data.
| Value | Description |
|---|---|
 S-Parameters S-Parameters
|
Toggles the display of S-Parameter spectra S (f) in the Chart
area. In the Frequency-Domain, this is a complex value chart.
Use  and and  to control the display of magnitude and phase plots.
 |
| Impedance
|
Toggles the display of impedance spectra Z(f) in the Chart
area. In the Frequency-Domain, this is a complex value chart.
Use and to
control the display of magnitude and phase plots. |
 Electric field
strength Electric field
strength
|
Toggles the display of the magnitude of the electric field strength spectra E(f) in the Chart area. |
 Voltage
in dB Voltage
in dB
|
Toggles the display of relative voltage spectra V(f)dB in the Chart area. |

| Value | Description |
|---|---|
 Standard
S-Parameters Standard
S-Parameters
|
Toggles the display of Standard S-Parameters for both magnitude
and phase. Use and to
control the display of magnitude and phase plots. |
 Mixed-Mode
S-Parameters Mixed-Mode
S-Parameters
|
Toggles the display of Mixed-mode S-Parameters for both magnitude
and phase. Use and to
control the display of magnitude and phase plots. |

| Value | Description |
|---|---|
 Magnitude Magnitude
|
Toggles the display of the magnitude spectra of a complex value chart. For example, the magnitude of an impedance plot |Z| (f). |
 Phase Phase
|
Toggles the display of the phase spectra of a complex value chart. For example, the phase of an impedance plot j=arc(Z)(f). |
Leaf Filter
| Value | Description |
|---|---|
 Pin Waveforms and Spectra Pin Waveforms and Spectra
|
Toggles the display of waveforms and their Fast Fourier Transform (FFT) spectra at the pin level of an active component. |
 Die Waveforms and Spectra Die Waveforms and Spectra
|
Toggles the display of waveforms and their FFT spectra at the die level of an active component. That is, behind a package from an outside view. |
 Test Load waveforms and Spectra Test Load waveforms and Spectra
|
Toggles the display of waveforms and their FFT spectra at driver pins when running a test load. This kind of waveform is used to derive flight time data. |
 Open Load waveforms and Spectra Open Load waveforms and Spectra
|
Toggles the display of waveforms at and their FFT spectra driver pins when running without any load. That is, in an open condition. This kind of waveform is used to derive flight time data. |
Component System Filter
| Value | Description |
|---|---|
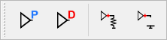
 Driver Pin Waveforms and Spectra Driver Pin Waveforms and Spectra
|
Enables the display of waveforms and their Fast Fourier Transform (FFT) spectra related to driver pins. This includes bi-directional pins when driving the signal. |
 Receiver Pin
Waveforms and Spectra Receiver Pin
Waveforms and Spectra
|
Enables the display of waveforms and their FFT spectra related to receiver pins. This includes bi-directional pins when acting as a receiver. |
 Passive Pin
Waveforms and Spectra Passive Pin
Waveforms and Spectra
|
Enables the display of waveforms and their FFT spectra related to passive component pins. |
 E-Net Level Waveforms and Spectra E-Net Level Waveforms and Spectra
|
Enables the display of waveforms and their FFT spectra at electrical net (E-Net) level. |
 Differential
Pair Level Waveforms and Spectra Differential
Pair Level Waveforms and Spectra
|
Enables the display of waveforms and their FFT spectra at differential pair level. |
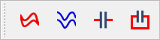
Differential and Common Mode Filter

| Value | Description |
|---|---|
 Common Mode Waveforms and Spectra Common Mode Waveforms and Spectra
|
Enables the display of common mode waveforms and their FFT spectra on differential pair level. These values are derived from the sum of the individual signals in the differential pair. |
 Differential Mode Waveforms and Spectra Differential Mode Waveforms and Spectra
|
Enables the display of differential mode waveforms and their FFT spectra on differential pair level. These values are derived from the difference of the individual signals in the differential pair. |
PI and EMI Filter
Additional filters are available in the PI and EMI mode.
| Value | Description |
|---|---|
 Combined Waveforms Combined Waveforms
|
The EMI and PI Working Sets may contain Probe Sets called "Combined".
These are calculated as a combination of multiple selected items.
For example, E-Nets, in the PI/EMI Analysis module. Use the filter
button  to enable or disable these types of Probe Sets. For example, a
combination of different decoupling capacitor (decap) impedances.
to enable or disable these types of Probe Sets. For example, a
combination of different decoupling capacitor (decap) impedances. |
 Single Waveforms Single Waveforms
|
The EMI and PI Working Sets contain Probe Sets for the selected
item, for example, a single E-Net, in the PI/EMI Analysis module.
Click  to toggle the display of the individual Probe Sets. For example,
the emission spectrum of a single E-Net.
to toggle the display of the individual Probe Sets. For example,
the emission spectrum of a single E-Net. |
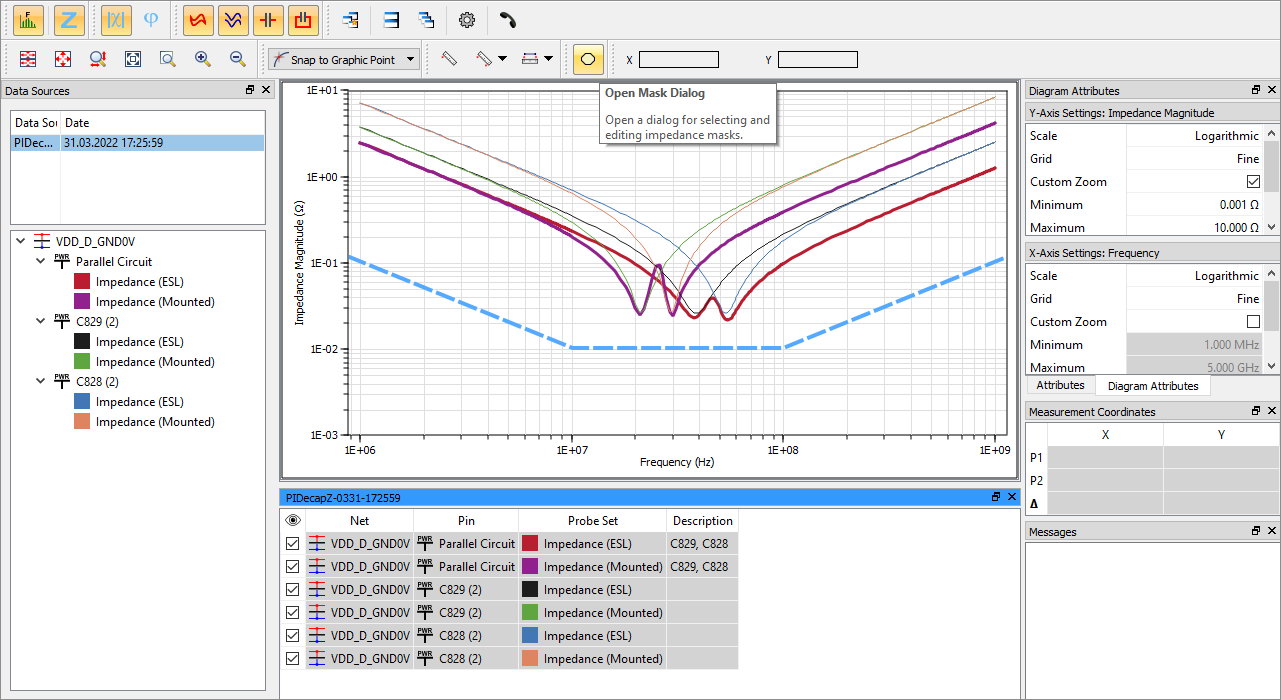
 Decap ESL Only
Impedance Decap ESL Only
Impedance
|
Decap Impedance results are calculated in the PI/EMI Analysis module, PI Decap view. This is done by right-clicking a selected decap, and using the assist menu. This button enables the display of the impedance of a decap, considering only its ESL. |
 Decap Mounted
Impedance Decap Mounted
Impedance
|
Decap Impedance results are calculated in the PI/EMI Analysis module, PI Decap view. This is done by right-clicking a selected decap, and using the assist menu. This button enables the display of the total mounting inductance of the decap, including the ESL value. |
Other Toolbars
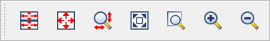
Zoom
The Zoom toolbar provides a range of zooming actions.
Zooming actions are also available using the keyboard or the mouse wheel. The supported shortcuts are described in this topic.
| Value | Description |
|---|---|
 Display All
in All Charts Display All
in All Charts
|
Changes the zoom factor so that all data is fully visible in all chart windows for the selected working set. The Show Zero Level setting is considered. This command is executed by pressing Shift+W. |
 Display All Display All
|
Changes the zoom factor so that all data is fully visible in the selected chart window. The Show Zero Level setting is considered by this zoom action. Alternatively, press the W key. |
 Custom Zoom Custom Zoom
|
The  button applies all enabled custom axis settings. Alternatively,
press Shift+C.
Define the custom axis ranges and the scale type in the Diagram
Attribute window.
button applies all enabled custom axis settings. Alternatively,
press Shift+C.
Define the custom axis ranges and the scale type in the Diagram
Attribute window. |
 Zoom Selected Zoom Selected
|
Changes the zoom factor so that all selected data is visible. The Show Zero Level setting is considered. |
 Zoom Area Zoom Area
|
Allows you to zoom into an area. Define the area within a selected plot window by dragging the cursor. |
 Zoom Zoom
|
Increases the zoom level by about 10%. Click  to revert this action.
Alternatively, use the + key in
a selected chart. to revert this action.
Alternatively, use the + key in
a selected chart.
|
 Zoom Zoom
|
Decreases the zoom level by about 10%. Click  to revert this action. Alternatively, use the -
key in a selected chart.
to revert this action. Alternatively, use the -
key in a selected chart.
|
Under the following conditions, these charts keep the same horizontal axis when zooming: multiple related charts, such as voltage, current and stimulus waveform, in the time domain within one Chart window.
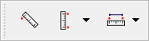
Interactive Measurement Actions
| Value | Description |
|---|---|
 Single
Point Measurement Single
Point Measurement
|
Perform a single point measurement on a selected chart. A crosshair cursor appears in the plot window, under the cursor position. Click to define the measured point. Its coordinates are logged in theMessageswindow. During the measurement, the coordinates of the measured point are shown in theMeasurement Coordinateswindow, as well as in the Chart window. Alternatively, press the.(dot) keyto initiate this measurement mode on a selected chart. |
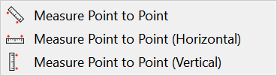
 Point-to-Point
Measurement Point-to-Point
Measurement
|
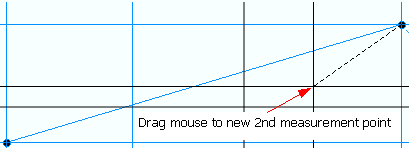
Initiate a measurement between two selected points. Perform
this action by clicking in a plot window. Drag the cursor, and
release it at the second point to be measured. The coordinates
of the first and second measured points are shown in the Measurement
Coordinates widow. The difference for the x and y coordinate
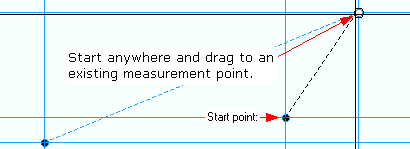
are shown separately. The final results are listed in the Messages window.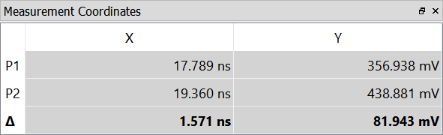 The measurement results are shown next to the arrow. Note If the length of the arrow is too short, then the text is suppressed. Zoom into the graphics to display the text.
Re-use an existing measurement point by initiating the point-to-point
measurement
Alternatively, start anywhere with the point-to-point measurement
|
  Strict Horizontal or
Vertical Point-to-Point Measurements Strict Horizontal or
Vertical Point-to-Point Measurements
|
The toolbar button allows you to select either a strict horizontal or strict vertical point-to-point measurement by clicking the displayed arrow. By selecting one of these menu options, either the horizontal or vertical measurement cursor position is fixed. This allows a precise measurement. For example, at a certain voltage level or point in time. Selecting either of these methods makes it the default mode for point-to-point measurement that is used subsequently. |
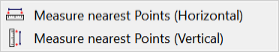
  2-Point Measurements 2-Point Measurements
|
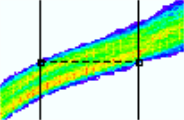
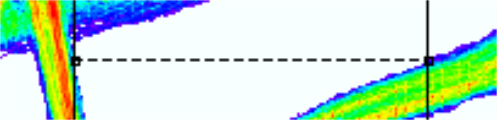
Initiate an automatic measurement between two points, either
horizontally or vertically at the current mouse position. Originating from the current mouse position, the nearest points in opposite directions are searched either vertically or horizontally. Selecting either of these measurement methods makes it the default mode for 2-point measurement. During the measurement, the coordinates of the two measured points are shown in the Measurement Coordinates window. The difference for the x and y coordinate are also shown, separately. The final results are listed in the Messages window. Alternatively, press the p key to initiate the currently-active measurement mode on a selected chart. Within an eye pattern, this measurement method can be applied inside or outside a colored area. In either case, the boundaries of the area are searched for the measurement. This provides a quick measurement of an eye opening, or the jitter of a signal, for example.
|
 :
:
To remove all measurement lines from the Chart display, right-click and select the Clear Measurements on the assist menu. This action also clears the display in the Measurement Coordinates window.
![]()
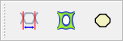
Snap Mode

Select the snap mode of the crosshair cursor when running a single point or point-to-point measurement. If no waveform is selected, then the closest one to the mouse position is followed.
| Value | Description |
|---|---|

|
The measurement cursor follows the waveform by its graphical representation. This allows a measurement between two data points, where the graphic shows an interpolated line between individual data points. |

|
The measurement cursor follows the waveform by its original data. This allows a measurement exactly on the data. |

|
The measurement cursor follows the current mouse position. |
Coordinates
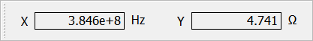
The current cursor position is shown in this toolbar for the x and y axis, depending on the respective units of the displayed quantity. In SI Eye Pattern mode, a third coordinate is added. This displays the number of occurrences in the Histogram view at the location given in X and Y coordinates.

Measured coordinates are displayed in a separate window.
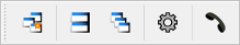
Chart Area
| Value | Description |
|---|---|
 New Working
Set and Chart Window New Working
Set and Chart Window
|
Creates a new, empty Working Set and empty Chart Window (Ctrl+N). The new Working Set name is [Set <new_number>], where the new number is the number of the last-created Working Set, increased by 1. The new Working Set is displayed in tabbed mode on top of the preceding Working Set (the one with <new_number>-1). You can drag the Working Set to display them in a different style. For example, next to each other. |
 Reuse Current Working
Set Reuse Current Working
Set
|
Allows you to specify the working set that probe sets are grouped into. An indicator on the Working Set interface shows how the probe sets are grouped. |
 Tile Window Tile Window
|
Display all Chart windows next to each other as tiles. |
 Cascade Window Cascade Window
|
Display all Chart windows on top of each other. |
 Settings Settings
|
Opens the Settings dialog. |
 Crossprobe Crossprobe
|
Allows you to cross-probe the selected item with other applications, such as eCADSTAR PCB Editor and PI/EMI Analysis Module, selecting the relevant item on the canvas in. Alternatively, press Ctrl+B. Note The cross-probing only works from Electrical Editor to Analysis Results Viewer. The Electrical Editor will not process cross-probing requests from Analysis Results Viewer. |
Frequency Domain Tools
Within the Frequency-Domain mode, additional function is available to open the Mask Editor to manage impedance masks.
Fast Fourier Transform (FFT) is performed
automatically if in the Frequency-Domain mode and the corresponding FFT
charts for voltage, current or stimulus are displayed. The FFT is computed
for all unfiltered probes in the working set. The FFT is automatically
recomputed as soon as you make changes to the window function in the Settings dialog  .
.
Eye Pattern
The following additional functions are available in the in the SI Eye Pattern mode.
| Value | Description |
|---|---|
 Switch Base Signal Trigger
|
Allows the SI Eye Pattern to be triggered by a selected
Base Signal. All SI Eye Patterns are aligned to the selected Base
Signal (the Eye Pattern is cut with the period time of the Base
Signal). The cut period time of the Eye Pattern can therefore
not be changed, and Custom Zoom is not available.
|
 Switch Eye Pattern
Mode Switch Eye Pattern
Mode
|
Allows you to switch between the monochrome and Histogram view for an Eye Pattern. |
 Open Mask Dialog Open Mask Dialog
|
Launches the Mask Editor. This allows you to select and define suitable masks, such as a Setup and Hold mask. |
Shortcuts
The following shortcuts can be used in the Analysis Result Viewer.
| Context | Function | Short Cut |
|---|---|---|
| File | Open | Ctrl+O |
| Export | Ctrl+E | |
| Close | Ctrl+W | |
| Ctrl+P | ||
| Settings | Ctrl+T | |
| Quit | Ctrl+Q | |
| Edit | New Working Set | Ctrl+N |
| View | Save Layout 1 | Ctrl+Shift+1 |
| Save Layout 2 | Ctrl+Shift+2 | |
| Save Layout 3 | Ctrl+Shift+3 | |
| Restore Layout 1 | Ctrl+1 | |
| Restore Layout 2 | Ctrl+2 | |
| Restore Layout 3 | Ctrl+3 | |
| Restore Default | Ctrl+0 | |
| Zoom | Display All | W |
| Display All in all Charts | Shift+W | |
| Zoom Area | Z | |
| Custom Zoom | Shift+C | |
| Working Set | Select All | Ctrl+A |
| Show Selected Only | D | |
| Remove Selected | Del | |
| Set Base Signal | B | |
| Set Strobe Signal | N | |
| Crossprobe | Ctrl+B | |
| Copy | Ctrl+C | |
| Interactive Measurement | Point Measurement | .dot |
| Point-to-point | m | |
| 2-Point Measurement | p | |
| Help | Online Help | F1 |
