
Task 16: Monte Carlo Analysis
Monte Carlo Analysis allows you to create a random value from a given tolerance on the original value. For example, a 20k Resistor with a 10% tolerance returns a random number between 18k and 22k. This allows you to simulate the tolerances provided with electronic components.
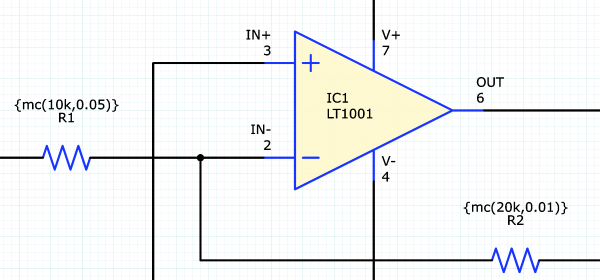
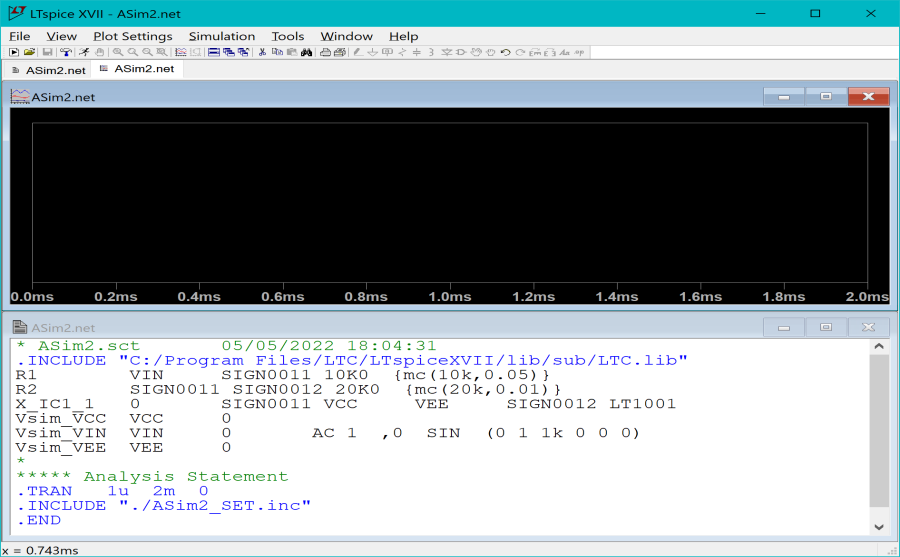
Using the function "mc" (Monte Carlo) you can specify an initial value, followed by a tolerance, which is specified as a decimal value. For example, a SPICE Parameter definition of {mc(10k,0.05)} can be defined for a component in the circuit.
Task 16: Monte Carlo Analysis
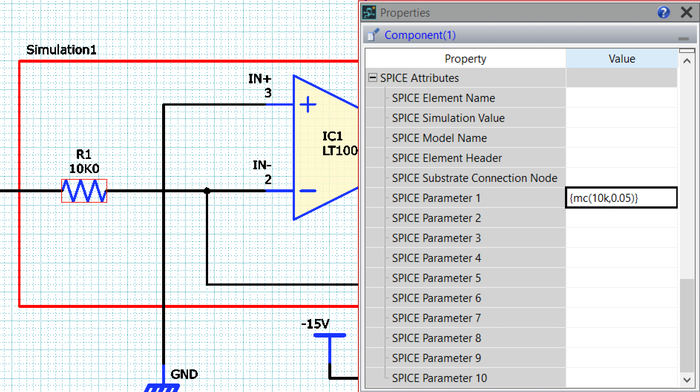
- Continuing with the same design, select the component R1, and locate the SPICE Parameter 1 property in the Properties panel.
- For this property, enter the value as "{mc(10k,0.05)}". This sets a random value for the resistor with the specified tolerance of 5%.
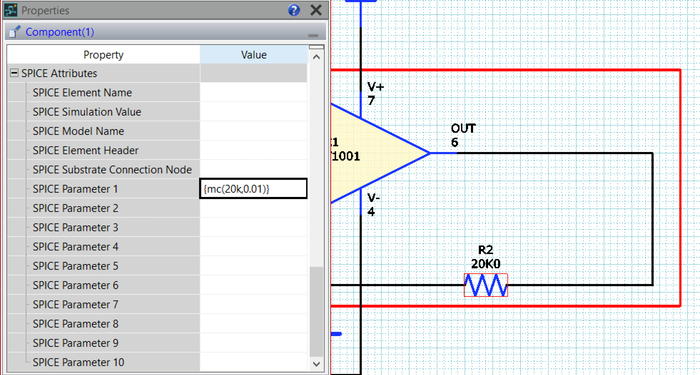
- Select the component R2, and locate the SPICE Parameter 1 property in the Properties panel.
- For this property, enter the value as "{mc(20k,0.01)}". This sets a random value for the resistor with the specified tolerance of 1%.
- On the eCADSTAR ribbon, select the Analysis tab and click Netlist Out.
- Click Yes when prompted to save the changes. The Netlist Out dialog is displayed.
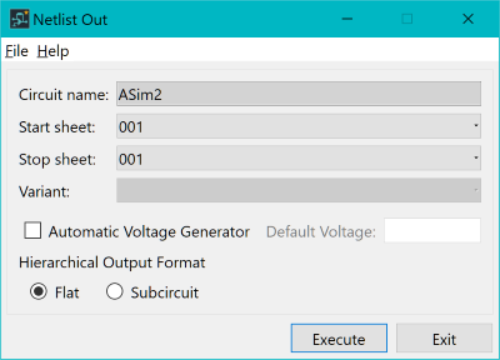
- In the Netlist Out dialog, select Automatic Voltage Generator and leave Default Voltage blank.
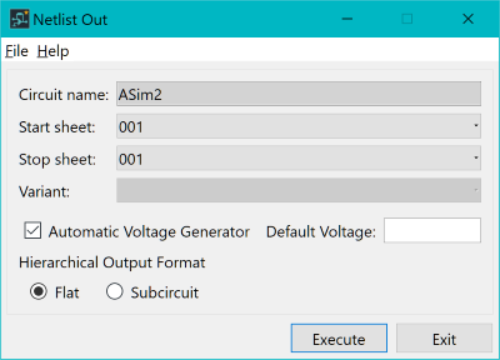
- Click Execute in the Netlist Out dialog to generate the netlist. Click OK in the information dialog to continue.
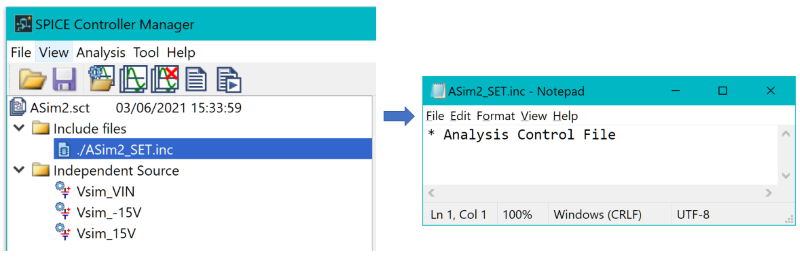
- SPICE Controller Manager is displayed.
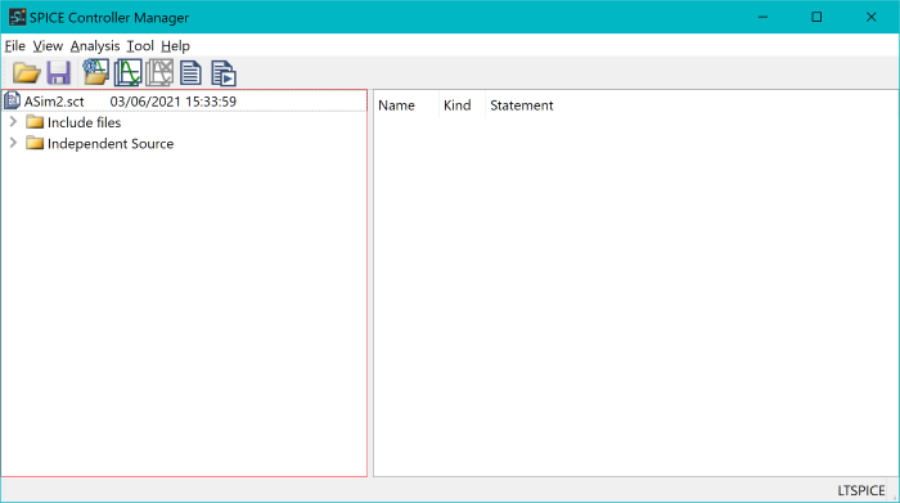
- Expand and select the Independent Source branch in the dialog.
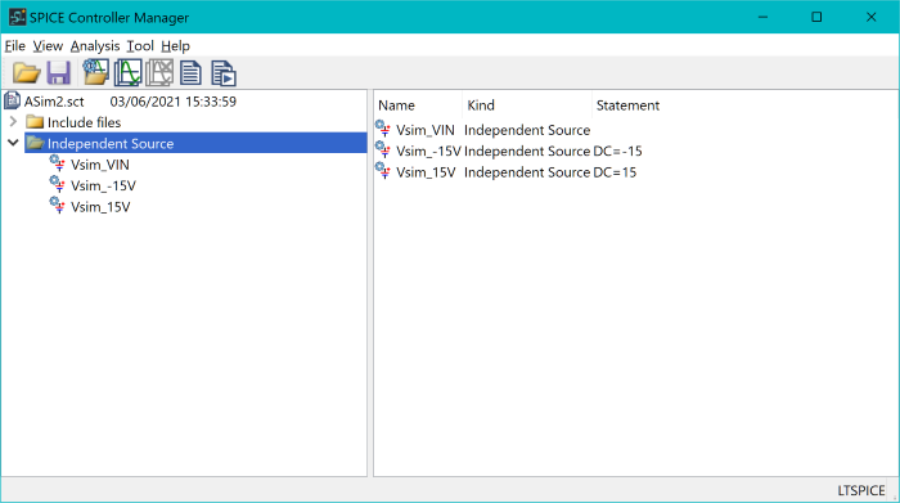
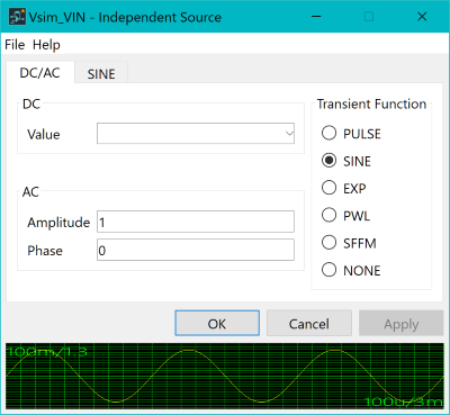
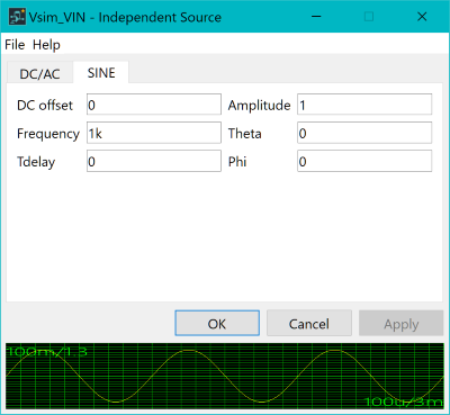
- Double click Vsim_VIN in the expanded list. The Independent Source dialog is displayed.
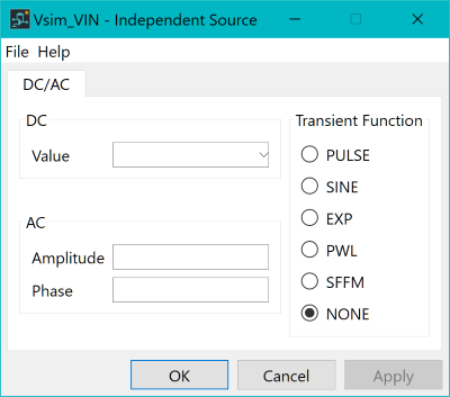
- Specify the values shown below, and click OK.
- In SPICE Controller Manager, expand the Include files item and double-click "./Asim2_SET.inc". The file opens in the text editor that is defined for SPICE Controller.

- Enter the following parameter into the file: ".step param run 1 100 1". This executes the simulation 100 times, starting at 1 and using increments of 1.
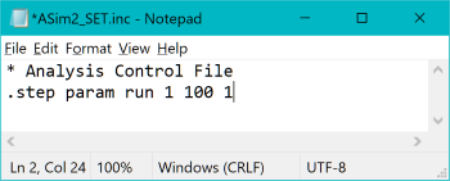
- Select File > Save in the text editor to save the data, and then close it.
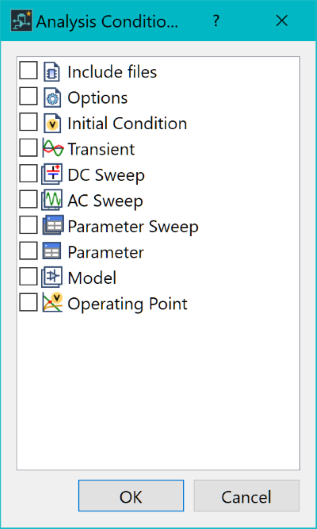
- On the SPICE Controller
Manager ribbon, select Insert Analysis
Condition
 . The
Analysis Condition dialog is displayed.
. The
Analysis Condition dialog is displayed.
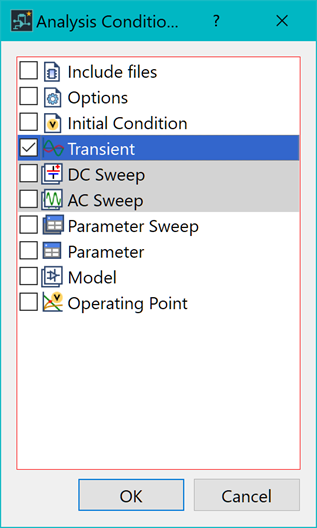
- In the Insert Analysis Conditions dialog, select Transient and click OK.
- In SPICE Controller Manager, double-click Transient 1. The Transient - SPICE Controller Manager dialog is displayed.
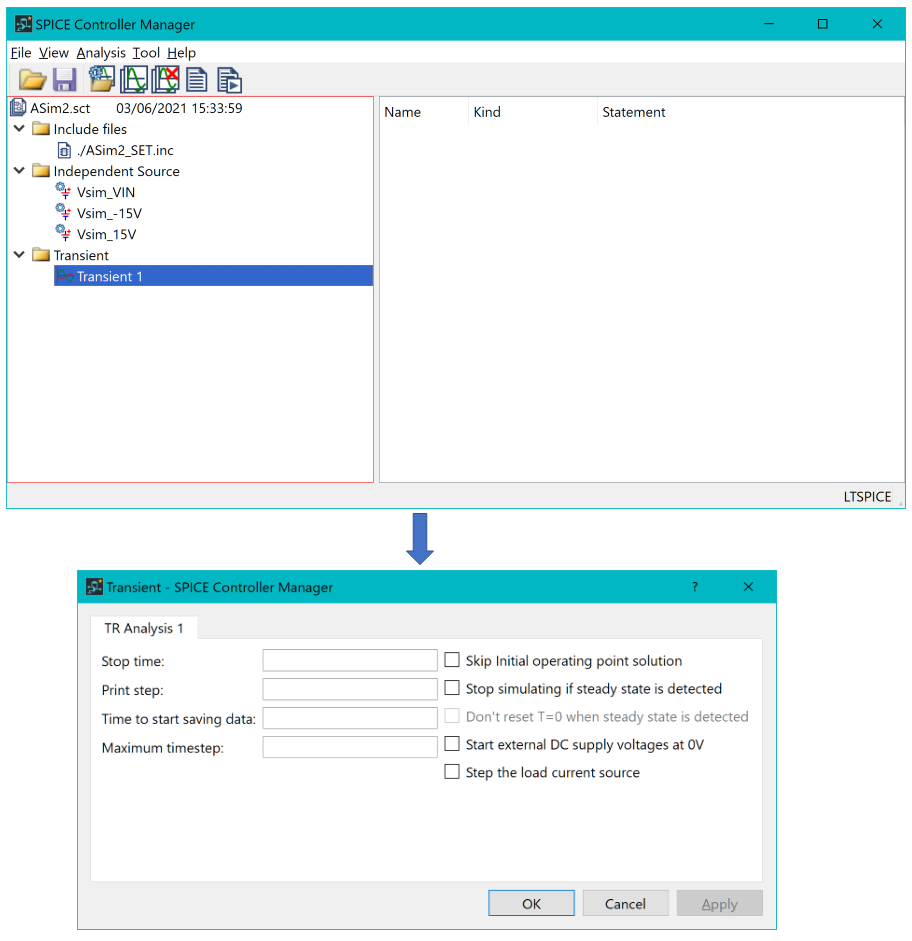
- In the dialog, specify the following.
- Stop time: 2m (representing 2 milliseconds).
- Print step: 1u (representing 1 microsecond).
- Time to start saving data: 0 (data is saved from the start of the recording).
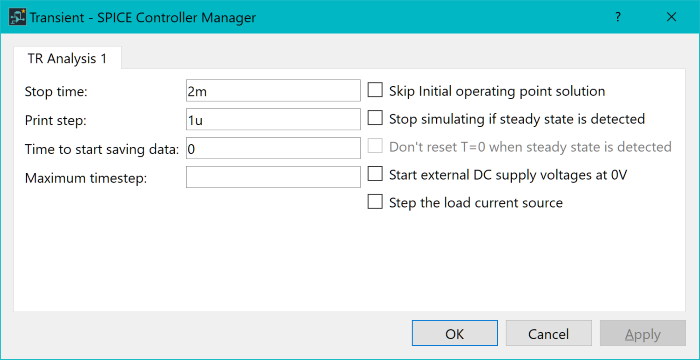
- Click OK to apply the settings and close the dialog.
- On the SPICE Controller
Manager ribbon, click Save
 to save the current data.
 - On the ribbon click Net
Output, Simulation
 to output an updated SPICE netlist. LTspice is launched, and the data
in eCADSTAR SPICE
Controller is simulated. All 100 simulations are processed before
results are shown in the LTspice application.
to output an updated SPICE netlist. LTspice is launched, and the data
in eCADSTAR SPICE
Controller is simulated. All 100 simulations are processed before
results are shown in the LTspice application.
The LTspice application may open with no items selected or displayed.
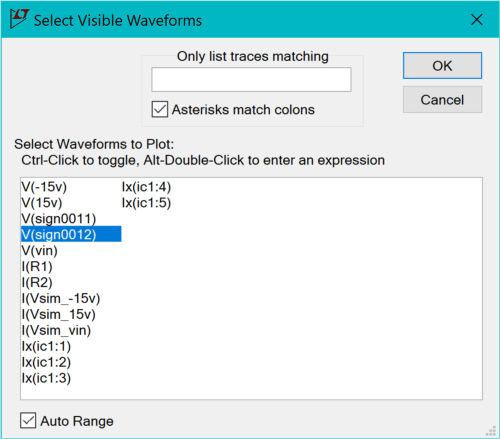
- In the LTspice application, click Plot Settings on the ribbon and select Visible Traces.
- In the Visible Traces dialog, select the signal V(sign0012) and click OK.
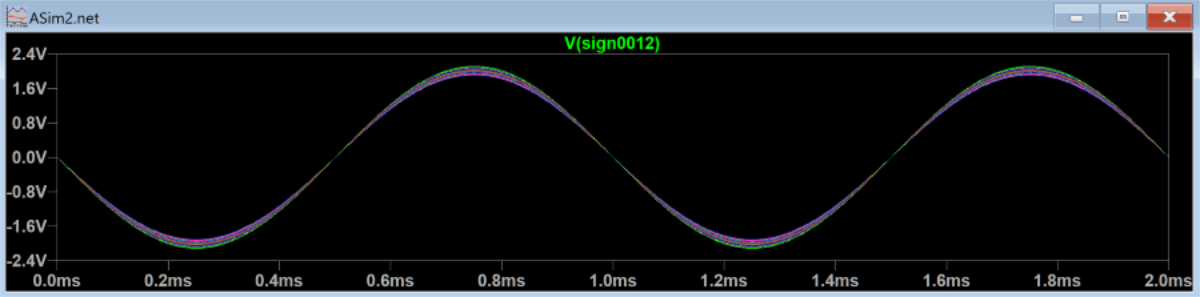
The graph will plot each simulation. Varying results are shown for each simulation because Monte Carlo Analysis is applied to the resistors in the circuit.
You have now completed the eCADSTAR SPICE Controller DIY training, and can close all eCADSTAR and LTspice applications.
