
The Options dialog allows
you to set the parameters for the PI/EMI
Analysis Heatmap dialog. It is launched
by clicking  Options on the toolbar in the PI/EMI
Analysis Heatmap dialog. The settings
that you specify are applied to the currently-displayed analysis results
Options on the toolbar in the PI/EMI
Analysis Heatmap dialog. The settings
that you specify are applied to the currently-displayed analysis results
View settings at startup
| Item | Description | |
|---|---|---|
| Enable gray scale view | selected | In order to improve the visibility of the heatmap, the relevant design is shown in gray scale on the canvas in eCADSTAR PCB Editor. You must relaunch the PI/EMI Analysis Heatmap dialog to apply this setting. |
| Not selected | The relevant design is shown in full color on the canvas in eCADSTAR PCB Editor. You must relaunch the PI/EMI Analysis Heatmap dialog to apply this setting. | |
| Specify layer set for map | selected | The layer view setting that you specify in the Layer Settings Panel, Layer Set section is applied when the relevant heatmap is displayed on the canvas. You must relaunch the PI/EMI Analysis Heatmap dialog to apply this setting. |
| Not selected | The layer view setting that you specify in the Layer Settings Panel, Layer Set section is not applied when the relevant heatmap is displayed on the canvas. You must relaunch the PI/EMI Analysis Heatmap dialog to apply this setting. |
Action settings
| Item | Description | |
|---|---|---|
| Show cursor information report | selected |
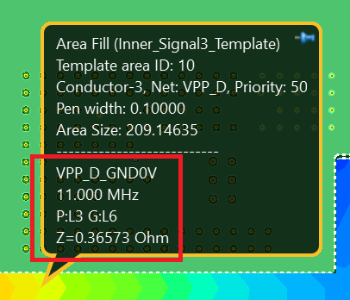
If you point the cursor at a position on the heatmap on the canvas, then heatmap information for the relevant position is displayed in the object balloon. In the following example, the power bus, frequency, layer pair and impedance values are shown for a particular position on a PI (Impedance) heatmap.
|
| Not selected | Heatmap information is not displayed in the object balloon when you point the cursor at a heatmap on the canvas. | |
| Change layer pair to active layer | selected | If you select a layer pair in the PI/EMI Analysis Heatmap dialog, Layer Pair section, then the active layer in eCADSTAR PCB Editor is changed to the power layer of the selected layer pair. This setting applies only to PI (Impedance) heatmaps. |
| Not selected | If you select a layer pair in the PI/EMI Analysis Heatmap dialog, Layer Pair section, then the active layer in eCADSTAR PCB Editor is not changed. |
View settings
| Item | Description | |
|---|---|---|
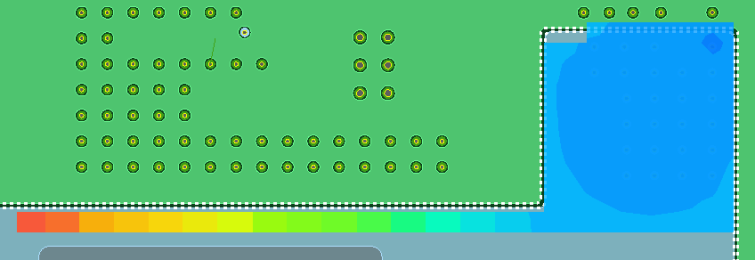
| Drawing pattern | Map | The analysis results are displayed on the canvas as a map.
This is illustrated below. If selected, then the Grid
diameter box is made unavailable
 |
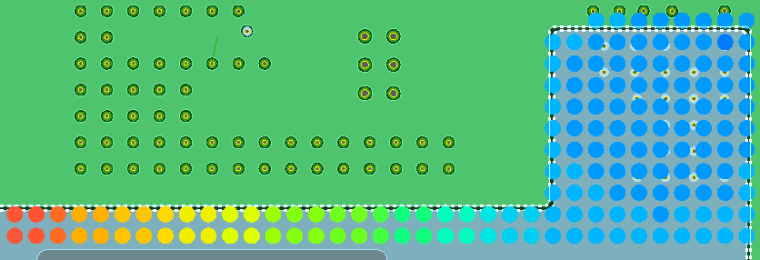
| Grid | The analysis results are displayed on the canvas as a grid.
This is illustrated below. You can specify the diameter of the
grid points in the Grid diameter
box. This is made available if Grid
is selected.
|
|
| Grid diameter | If Grid is selected as a drawing pattern, then you can specify the diameter of the grid points in this box. | |
| Transparency for map | Specify the transparency of the heatmap by dragging the slider or entering a percentage value in the accompanying box. To make the heatmap completely opaque, specify a value of zero. | |
| Show current arrow (DC - Current density map) | Selected |
If the analysis result being displayed is DC (Current density), then the current direction is indicated by arrows. An example is shown below. You can specify the length of the arrows in the Arrow length box. 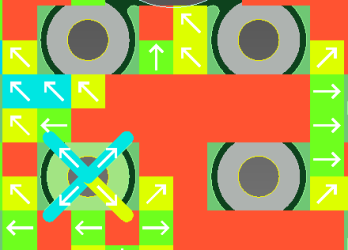 |
| Not selected | The current direction is not shown. The Arrow length box is made unavailable. | |
| Arrow length | If Show current arrow (DC - Current density map) is selected, then you can specify the length of the arrows by entering a value. | |
| Char. scaling | Linear | The colors in the heatmap are directly linked to the values in the analysis result. Select this option when the values are uniformly distributed between the minimum and maximum. |
| Logarithmic | The colors in the heatmap are linked to the logarithmic value of the analysis result. Use this option if most of the values are close to the maximum value. | |
| Inverse Log | The colors in the heatmap are linked to the inverse logarithmic value of the analysis result. Use this option if most of the values are close to the minimum value. | |
