
The Settings dialog allows you to specify the formatting of the data that you generate in the Report Generator dialog, including the information in the header and footer. You can define how numeric values are represented, and select the units that are used. You can also rotate and offset the data that is generated, and specify whether it is shown for side A or side B of the board, or for the relevant placement side.
It also allows you to set the formatting that is required when exporting data by clicking Save as. For example, you can ensure that the data exported to a .csv file is formatted correctly. Display this dialog by clicking Settings in the Report Generator dialog. See the following video:
General
The General tab allows you to specify the formatting of the data that you generate in the Report Generator dialog.
| Item | Description | |
|---|---|---|
| End-of-record delimiter | By default, the "\n" value is displayed in this box. This is the line feed command. If you remove this value, then items are shown on the same row for all components. Additionally, you can specify a string before the "\n" value, which is displayed at the end of each component record. For example, if you add the value " End of row \n" and specify Reference Designator and Placement Status in the Output items table, then the generated data is formatted as follows. C20 PLACED End of rowC21 PLACED End of rowC22 PLACED End of rowC23 PLACED End of row. | |
| Item delimiter | Allows you to add a string, which is displayed between each of the items specified in the Output items table, in the Report Generator dialog. For example, if you add the value " *** " and specify Reference Designator, Placement Status and Fixed in the Output items table, then the generated data is formatted as follows. C20 *** PLACED *** NOC21 *** PLACED *** NOC22 *** PLACED *** NOC23 *** PLACED *** NO. By default, the " " (space) character is used. | |
| Group delimiter | When grouping the generated data in Report
Generator, this field allows you to specify the string that
is used to separate the values displayed as a single column. By
default, the "|" (vertical bar) character is used. For
example, if Part Name and Reference Designator are specified
in the Output items
table, then the generated data is formatted as follows when grouped
by Part Name.
GRM0332C1H100GA01D
C10|C11GRM033R61C104KE14D
C12|C14|C17|C18|C19|C20|C21|C25|C26|C27|C28GRM188R60J106ME47D
C13|C15CL05A475MQ5NRNC C16|C22|C23|C24
Note To group the generated data on a particular item in Report Generator, select Grouping in the Format options section and then select Grouping in the Output items table for the relevant item. |
|
| Coordinates delimiter | The string that is used as delimiter between the X and Y values of coordinates. By default, the "," (comma) value is used. | |
| Blank value | Allows you to specify the string that is displayed in the Report Generator Preview dialog and Report preview box when no data exists in the design for a specified item. By default, the "-" (hyphen) character is used. | |
| Specify for each item | For a particular attribute in the Output items table, this field allows you to override the value specified in the Default strings field. If no data exists in the design for the relevant attribute, then the value in this field is displayed, rather than the value in the Default strings box. If selected, then the Default string column is added to the Output items table in the Report Generator dialog. Specify a value in the Default string column and press Return. | |
| Show line numbers | Selected | For the data that is displayed for each section specified in the Section box in Report Generator, a line number is added to the beginning of each line in the Report Generator Preview dialog and Report preview box. A unique integer greater than zero is used, which is incremented for each row of data in each section. If you change the data that is generated, then it is renumbered. |
| Not selected | A line number is added to the beginning of each line in the Report Generator Preview dialog and Report preview box. |
Unit/Angle
The Unit/Angle tab allows you to define how numeric values are represented in the Report Generator dialog. You can select the units for numeric data, specify the number of decimal places and select whether the decimal point is displayed. You can also specify the formatting of the data relating to angles.
| Item | Description | |
|---|---|---|
| Units | Allows you to select the units that are used for numeric data, specify the number of decimal places and select whether the decimal point is displayed. | |
|
Units |
|
|
| Decimal places | Allows you to specify the number of decimal places for the
data generated in the Report Generator
dialog. Select a value between 0
and 5. If you select a value
other than 0, then you can also
specify whether the decimal point is displayed.
Note If you select Integer in the Angle section, Format field, then values for angles are displayed as whole numbers, regardless of the value specified in the Decimal field. |
|
| Show decimal point | For values that are displayed to greater than zero decimal
places, this setting allows you to specify whether the decimal
point is displayed. This check box is made available if you select
a value other than 0 in the
Decimal box.
|
|
| Angle | Allows you to specify the range of values that are used for angles that are displayed in the generated data. | |
| Range |
|
|
| Format |
|
Format
The Format tab allows you to rotate and offset the data that is generated. You can also specify whether it is shown for either side A or side B of the board, or for the relevant placement side.
| Item | Description | |
|---|---|---|
| Rotation | Allows you to specify the angle and reference point that all coordinate values in Report Generator are rotated by. | |
| Angle | Allows you to rotate all coordinate values that are displayed
in Report Generator by a specified
angle in the counterclockwise direction. Items are rotated relative
to the reference point of the board that is specified in the Reference point X: and Reference
point Y: fields. Specify a real number that is greater
than or equal to "0", and less than "360".
Alternatively, select a value from the following options.
|
|
| Reference point X: | Allows you to specify the X coordinate of the rotation reference point, in millimeters. Specify a real number between -5000.0 and 5000.0. When you rotate the coordinates of the board by specifying a value in the Angle box, all coordinate values that are displayed in Report Generator are rotated relative to the specified reference point. | |
| Reference point Y: | Allows you to specify the Y coordinate of the rotation reference point, in millimeters. Specify a real number between -5000.0 and 5000.0. When you rotate the coordinates of the board by specifying a value in the Angle box, all coordinate values that are displayed in Report Generator are rotated relative to the specified reference point. | |
| Offset | Allows you to offset the coordinate values that are displayed in Report Generator by a specified value in the X or Y direction. Specify a real number in millimeters. | |
| X: | For coordinate values that are displayed in Report Generator, specify a value to offset them in the X direction. Specify a real number in millimeters. | |
| Y: | For coordinate values that are displayed in Report Generator, specify a value to offset them in the Y direction. Specify a real number in millimeters. | |
| Mirror | Allows you to specify whether coordinates and component angles are viewed form either Side A or Side B of the board, or from the placement side of each object. You can also specify the direction in which objects are flipped, and the coordinate reference point for side B. | |
| Coordinates | Allows you to specify whether coordinate values are displayed
as viewed from side A, side B or from the placement side of each
object on the board.
|
|
| Direction | Allows you to specify whether objects are flipped in either
the X or Y direction when the board is viewed form side B. This
field is made available when Side B
or Placement side is selected
in the Coordinates field.
|
|
| Base point X: | If Side B or Placement side is selected in the Coordinates box, then specify the reference point for the X coordinate, in millimeters. Specify a real number between -5000.0 and 5000.0. | |
| Base point Y: | If Side B or Placement side is selected in the Coordinates box, then specify the reference point for the Y coordinate, in millimeters. Specify a real number between -5000.0 and 5000.0. | |
| Component angle | Allows you to specify whether placement angles are displayed
as viewed from either side A or side B of the board, or from the
placement side of each object.
|
Header/Footer
The Header/Footer tab allow you to specify the contents of the header and footer that is shown at the top and bottom of the report, respectively, in Report Generator. You can add the following variables as placeholders, which are populated with data when you generate the report. For example, if you add the TIME variable to the Header section, then the time that the report was generated is displayed at the top of the report. To use a variable in a report, add the "$" character to the start and end of the variable. For example, the variable name LOGIN would be added to the header or footer box as $LOGIN$. You can also add text, which is displayed with the variables when the report is generated. Variables must be added in upper case.
| Value | Description |
|---|---|
| DATE | Displays the date that the report was generated. The format of the date is taken from the system setting on your computer. |
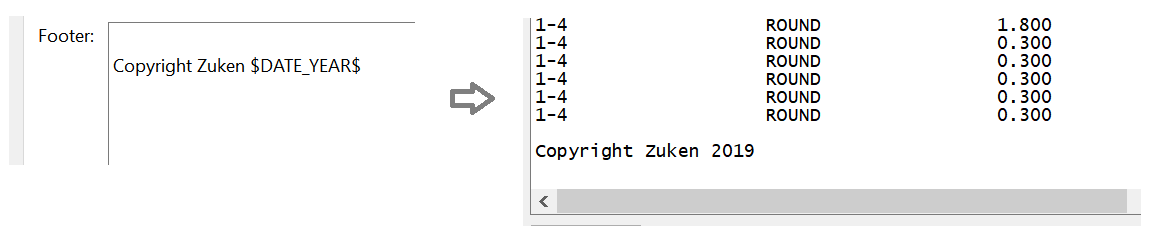
| DATE_YEAR | Displays the year in numeric format that the report was generated. The format of the date is taken from the system setting on your computer. |
| DATE_MONTH | Displays the month in numeric format that the report was generated. The format of the date is taken from the system setting on your computer. |
| DATE_DAY | Displays the day in numeric format that the report was generated. The format of the date is taken from the system setting on your computer. |
| DATE_WDAY | Displays the day that the report was generated, in textual format. For example, "Monday". |
| TIME | Displays the time that the report was generated. The format of the time is taken from the system setting on your computer. |
| TIME_HOUR | For the time that the report was generated, the "hour" component is displayed. |
| TIME_MIN | For the time that the report was generated, the "minutes" component is displayed. |
| TIME_SEC | For the time that the report was generated, the "seconds" component is displayed. |
| LOGIN | Displays the user name of the user who is currently logged on to the computer running eCADSTAR. |
| HOST | Displays the name of the computer on which eCADSTAR is currently running. |
| DESIGN_FILE_PATH | Displays the path to the currently-open design. If you create a report for a newly-created design, then just the name of the design file is displayed, followed by an asterisk. For example, "Design1*". |
| DESIGN_FILE_NAME | Displays the name of the currently-open design. If you create a report for a newly-created design, then just the name of the design file is displayed, followed by an asterisk. For example, "Design1*". |
| PRM_FILE | Shows the path to the .prgx parameter file that you specify in the Parameter file section of the Report Generator dialog. If you create a new parameter file and have not yet saved it, then "<new parameter file>" is displayed. |
| PRM_FILE_NAME | Shows the .prgx parameter file that you specify in the Parameter file section of the Report Generator dialog. If you create a new parameter file and have not yet saved it, then "<new parameter file>" is displayed. |
| PRM_COMMENT | Displays the value that you specify in the Description box in the Report Generator dialog. |
| VARIANT | If the current design has variants, then the variant label is displayed for the variant selected in the Report Generator dialog, Variant field. If the current design does not have variants, then "Master" is displayed. |
| UNIT | Displays the units that you specify in the Number tab, Unit field, in this dialog. |
| PRECISION | Displays the units that you specify in the Number tab, Decimal field, in this dialog. |
| COORDINATE_DELIMITER | Displays the delimiter that is currently used for coordinates in the Report Generator dialog. This is specified in the Coordinate tab, Item delimiterdelimiters field, in this dialog. |
| RECORD_DELIMITER | Displays the string that is currently used to specify the end of the record for each component. This is specified in the Text tab, End-of-record delimiter field, in this dialog. |
| SEGMENT_DELIMITER | Displays the string that is currently displayed between each item in the Output items table, in the Report Generator dialog. This is specified in the Text tab, Item delimiter field, in this dialog. |
| ITEM_DELIMITER | Displays the string that is used to separate the values displayed as a single column when grouping the generated data in Report Generator. By default, the "|" (vertical bar) character is used. |
- eCADSTAR uses both the "Short date" and "Long date" system settings on your computer, when formatting dates. If you change the date settings on your computer, then eCADSTAR must be restarted in order for dates to be shown in the new format.
- You can separate the items that you enter in the Header/Footer tab using the Tab key. This creates a space of 80 pixels between them. As this space is defined using pixels, it could be displayed differently depending on the resolution of your monitor. If you output the generated data by clicking Save as in the Report Generator dialog, then you can change the value associated with the "Tab" item in the report. However, this will depend on the application used to open the report.
| Value | Description |
|---|---|
| Header | The Header box allows you
to specify the contents of the header that is displayed at the
top of the report in Report Generator.
You can specify text, as well as the variables shown here.
For example, if you add the following content to the Header
box, then the header is created as shown.
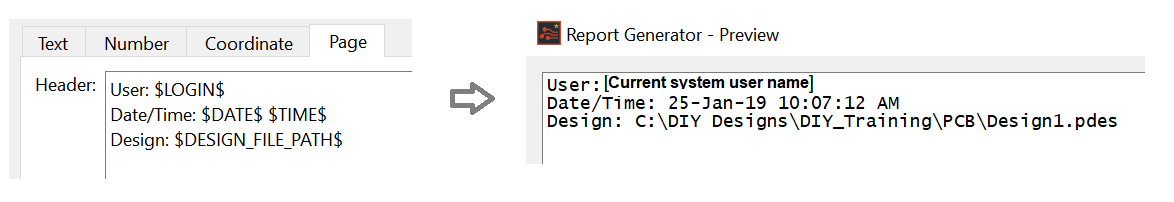 |
| Footer | The Footer box allows you
to specify the contents of the footer that is displayed at the
bottom of the report in Report Generator.
You can specify text, as well as the variables shown here.
For example, if you add the following content to the Footer
box, then the footer is created as shown.
 |
