

The Analysis Result Viewer is a multi-purpose display tool for analysis results, which provides multi-domain functionality. It allows you to view results for different types of analysis, including time and frequency domains. The displayed physical quantities include electrical values for the following.
- Voltages
- Currents
- Impedances
- Electric fields
- S-Parameters
- Logic signals
The viewer can also display other quantities. Results data can be exported to CSV or image files.
The Online Help describes the Analysis Result Viewer in the context of Signal Integrity (SI) and EMC Analysis. The Analysis Result Viewer operates in the following modes.
- SI Mode (including SI Parameter Sweep)
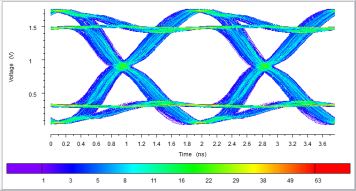
- SI Eye Pattern and AMI Eye Pattern Mode
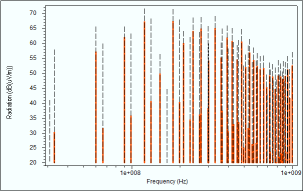
- PI/EMI and S-Parameter Mode
The operation mode depends on the type of data source file. For details on the operation modes, see: Result Viewer: Data Sources.
The available toolbar icons, data source structure and working set operations are dependent on the mode. However, the toolbars, menus, etc. operate similarly in the different modes. For a description of the individual elements of the interface, see: Elements of the Analysis Result Viewer Interface.
