
To perform AMI Analysis, click Execute in the AMI Analysis dialog. The AMI analysis is performed using the displayed parameters. This includes the selected AMI parameter set, and the impulse response function of the analog channel. The AMI Analysis dialog stays open. This allows you to perform additional simulations in parallel. For example, with different settings for skip bits.
- Before executing the AMI Analysis, it is strongly recommended that you view the impulse Response function. However, this is not essential.
- Other parameters that are mentioned in the model's data sheets must also be set accordingly.
The progress of the simulation is shown in the Analysis
Task Monitor. This is located in the task list for the Operating
System, as shown below.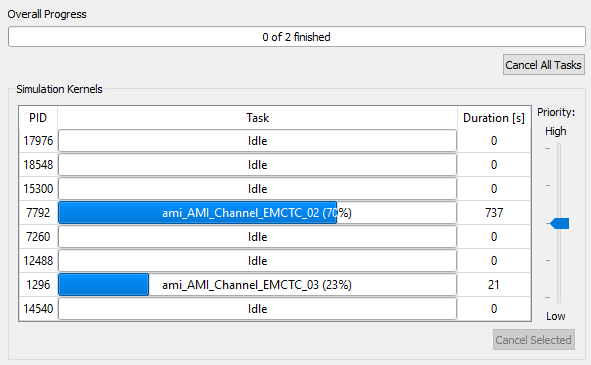
If you launch a simulation task in error, then click Cancel Selected or Cancel All Tasks to abort it.
When the simulation is complete, the results are displayed in Analysis Result Viewer. To display a pop-up notification when the simulation starts and ends, see: Receiving Pop-up Notifications from the Analysis Tools.
- Individual Analysis Result Viewer windows are opened for the following result types: Eye Pattern, Time-Domain results and Frequency-Domain results. Results of the same type, for example, impulse responses that are based on different frequency settings are shown in the same Analysis Result Viewer instance. Initially, these are displayed in individual Working Sets.
- See the Analysis Result Viewer Help for more information on this functionality. For example, on how to automatically view all Impulse Response functions within one Working Set.
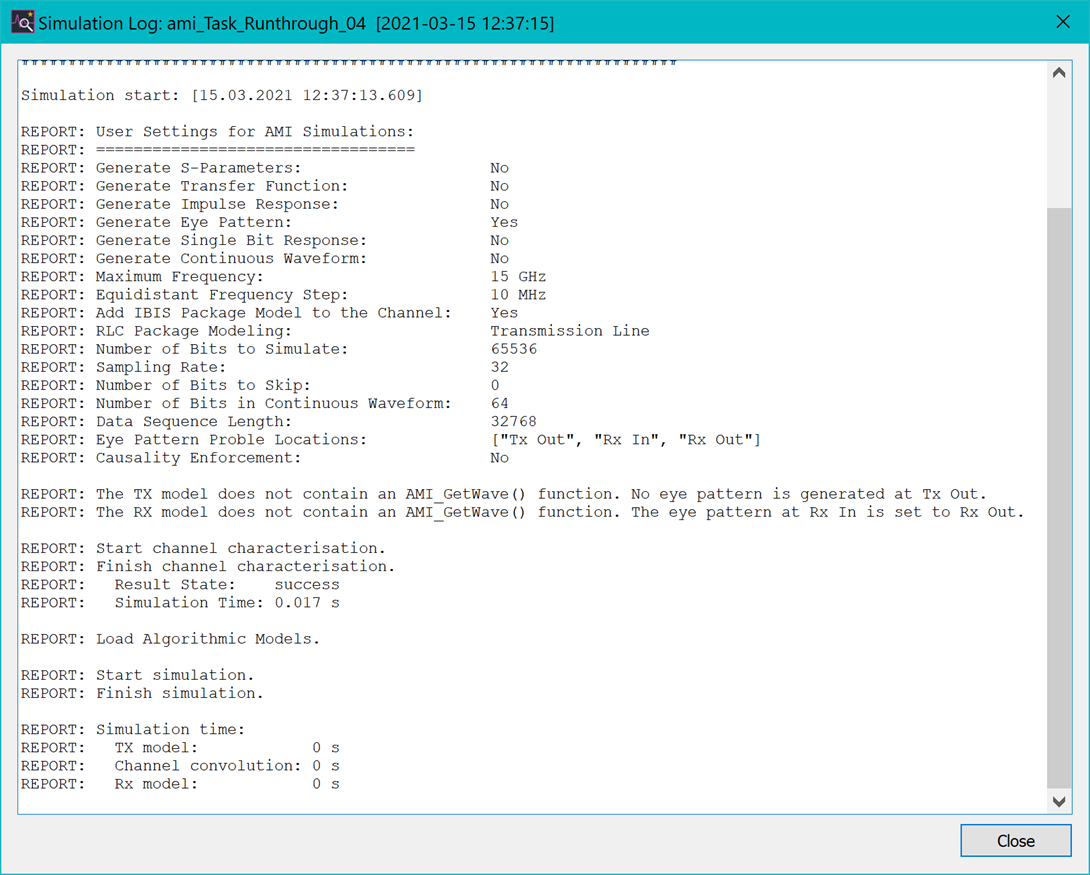
- View the simulation
log file for a selected data source by right-clicking in the Data Sources section, and selecting Show Simulation Log on the assist menu.
The Simulation Log dialog lists the
AMI Analysis settings, and also reports AMI Output parameters if these
are adjusted by the AMI model.
AMI Output Parameter
AMI Output parameters which are changed by the algorithmic model during AMI simulation can be reviewed in Analysis Result Viewer. The AMI Eye Pattern can also be reviewed here. This view is essentially the same element that is used in the AMI Parameters dialog, but shown as a tree view. Values that are modified as a result of the AMI analysis are indicated with a red background color.
Eye Pattern Results
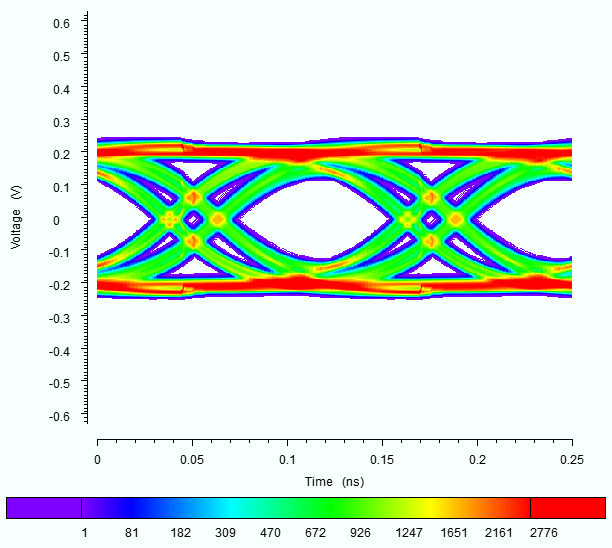
Eye Patterns are computed for selected probes by cutting the continuous waveforms into samples of 2 unit-interval (UI) length. These samples are overlaid on top of each other to create an Eye Pattern. The Eye Pattern is automatically centered, but can be shifted graphically in the Analysis Result Viewer. Eye Patterns can be visualized as follows in Analysis Result Viewer.
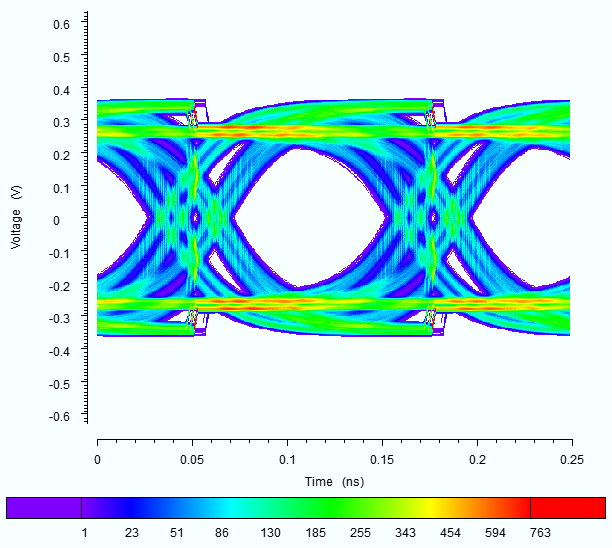
- As a histogram plot. Each point in the voltage-time plane is colored according to the occurrence of a voltage waveform within the unit intervals at that particular (v,t) location. The occurrence is mapped automatically to a color scheme. Violet indicates a low occurrence. Red indicates a high occurrence.
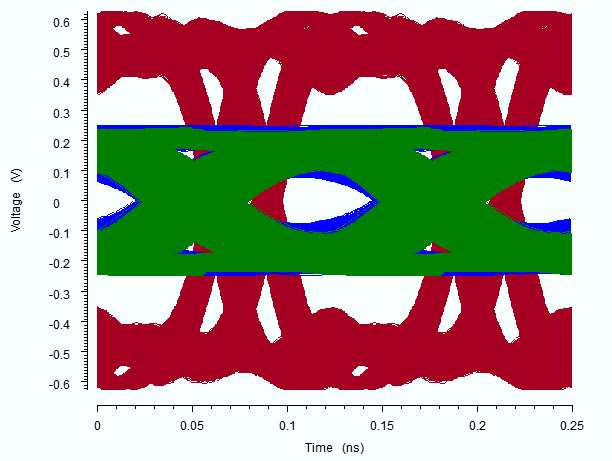
- Alternatively, the Eye Pattern can be displayed in monochrome. Each probe is displayed in its color on top of each other.
To toggle between the monochrome and histogram Eye Pattern,
click the  button in the Eye
Pattern toolbar in Analysis
Result Viewer.
button in the Eye
Pattern toolbar in Analysis
Result Viewer.
The following example shows Rx Out Eye Pattern for 10000 bits (left) and 250000 bits (right) of the same channel.
Bits to simulate: 25.000
Skipped bits: 1.000
Bits to simulate: 250.000
Skipped bits: 100.000
All Eye Patterns within a single AMI Analysis are computed with the same resolution in both the time and voltage range. In Analysis Result Viewer, the histogram data cannot be modified. For example, you cannot zoom in to the data.
If the Rx In probe delivers a different voltage range, then turn off this probe in the subsequent computation to view the Rx Out Eye Pattern in a better voltage range.
Bit Error Ratio (BER)
Using the zero-crossings of the continuous waveform at the Rx Out probe location, a time-interval error (TIE) is calculated between the clockticks and the zero-crossings. The reference clockticks may be provided as an output result of the Rx AMI model. Otherwise, the reference clockticks are derived from the stimulus information.
- The TIE value is used to predict the Bit Error Ratio (BER) of the channel, as a figure of merit.
- The BER is plotted against the horizontal eye opening
in a "bathtub" curve in Analysis
Result Viewer. To toggle the display of the bathtub curve in Analysis Result Viewer,
click the
 button on the toolbar.
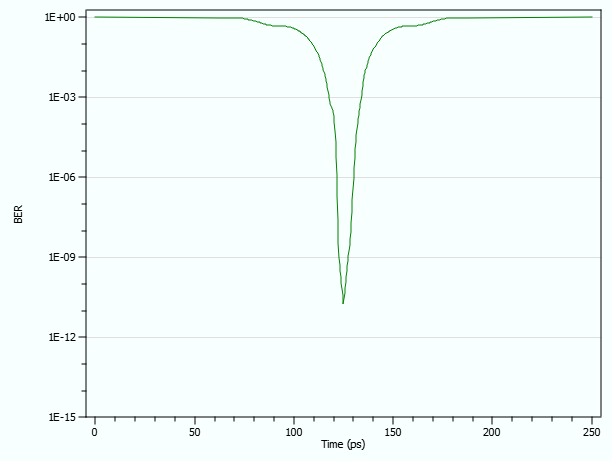
- Based on the calculated TIE, the BER is extrapolated by using statistical methods which exploit Jitter data on the channel.
- A BER of 10-15 is the lower limit that is predicted by AMI Analysis.
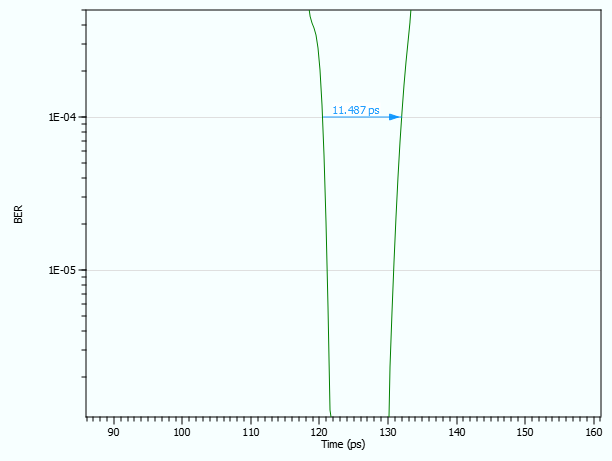
- To measure an eye opening at a particular BER of
10-4, for example, use the 2-point measurement
 in Analysis Result
Viewer. If necessary, use the zoom function.
in Analysis Result
Viewer. If necessary, use the zoom function.
Continuous AMI Waveforms
To inspect the Time-Domain behavior of the AMI models and the serial channel before a potentially time-consuming AMI Analysis of millions of bits, you can compute a short section of the Continuous AMI Waveform as follows.
- Specify a Length of Waveform value between 8 and 1024 bits.
- Click the View button to display the AMI Analysis results for the specified number of bits. The displayed Time-Domain waveform starts directly after the skip-bits. If you choose 0 skip-bits, then the initialization process of the AMI models can be examined.
As the number of skipped bits must be simulated, this may require significant computation time, regardless of the number of displayed bits.
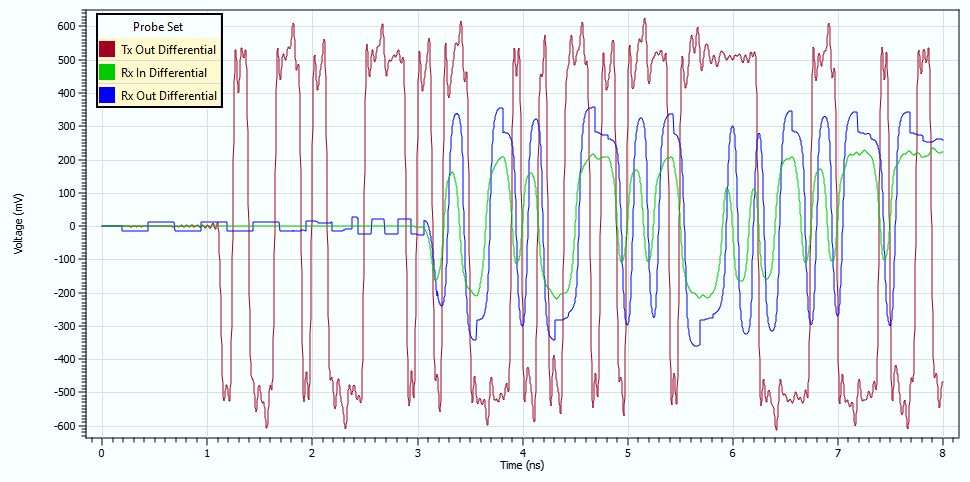
The following is another example of the Continuous AMI Waveform.
