
Net Graphics
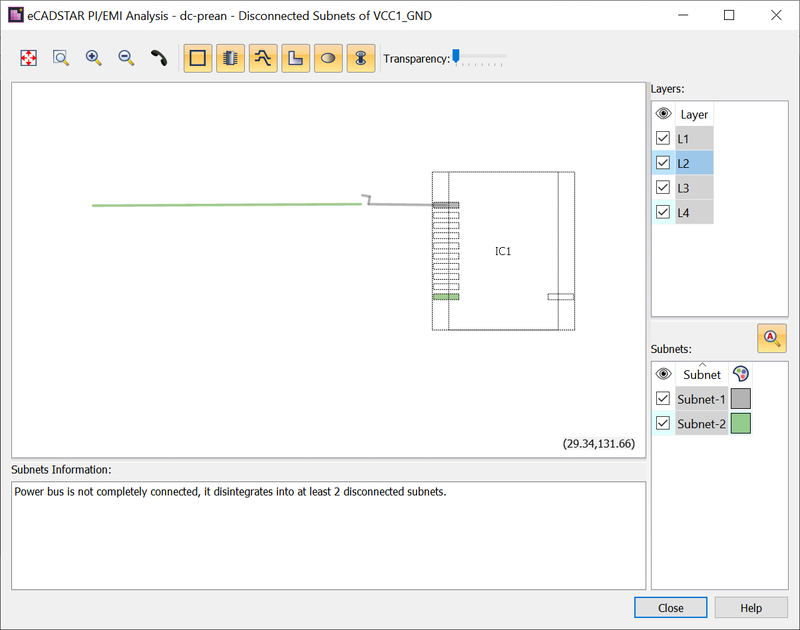
The Net Graphics dialog, within the EMI/PI Analysis module, lists the disconnected subnets which are identified when DC Analysis is executed. Its purpose is to identify usually small mismatches of vias, pads or track segments which prevent successful DC Analysis. Use the filter buttons on the toolbar to help with this. Mismatches in the layout data must be corrected on the canvas in eCADSTAR PCB Editor.
In the DC Analysis results, launch this dialog from the Power Bus view, by right-clicking in the Result Status column for the corresponding error. Select Show Disconnected Subnets on the assist menu. Alternatively, point the cursor in this column and then click the displayed ![]() button. In the displayed DC Messages dialog, click
button. In the displayed DC Messages dialog, click  Show Disconnected Subnets.
Layout data is shown which is present in the EMI/PI Analysis module. This may differ slightly from the actual layout, and from the level of detail required for manufacturing purposes. It is not intended to replace the full featured functionality of the layout display in eCADSTAR PCB Editor.
The dialog comprises a central Graphics view, a toolbar and a Message box at the bottom. On the right side, check boxes allow you to toggle the display of items, including layers and signals.
You can open multiple instances of the dialog simultaneously.
Toolbar
| Item | Description |
|---|---|

|
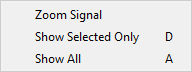
Show All |

|
Zoom Area
You can also zoom using the mouse wheel. On the keyboard, the + and - keys allow you to zoom displayed items. The W key shows the entire board. Note Some object details are not shown until you zoom into a certain level of detail. |

|
Zoom In
You can also zoom using the mouse wheel. Alternatively, use the + key on the keyboard. |

|
Zoom Out
You can also zoom using the mouse wheel. Alternatively, use the - key on the keyboard. |

|
Crossprobe |

|
Show/Hide Board Outline |

|
Show/Hide Components |

|
Show/Hide Tracks |

|
Show/Hide Planes |

|
Show/Hide Pin Pads |

|
Show/Hide Via Pads |
| Transparency | The Transparency slider changes the transparency of the Net Graphics dialog. This allows you to place the dialog on top of the canvas in eCADSTAR PCB Editor to align objects on top of each other. This may help you identify design objects in eCADSTAR PCB Editor when editing the layout. |
Graphics View
Disconnected subnets are displayed in the Graphics view.
- Right-click an item to display the available commands on the assist menu. The keyboard shortcut "D" is useful for viewing each item of a list.
- Keep the middle mouse button pressed to move a displayed item.
- Use the Up, Down, Left or Right arrow keys to move the visible layout area in the respective direction.
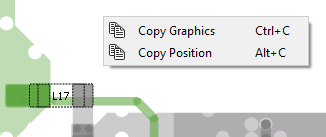
- When viewing displayed graphics, right-click to display the assist menu. This shows the commands that are available depending on the position of the cursor.
- The coordinates of the cursor position are shown at the bottom of the Graphics view. This helps to locate relevant objects on the canvas in eCADSTAR PCB Editor.
Layers
Allows you to select the layers that are visible in the Graphics view.
| Item | Description |
|---|---|

|
For each layer that is listed in the Layers table, select the associated check box to display it in the Graphics view, |
| Layer | The conductor layers in the associated design are listed. To make multiple layers visible in the Graphics view, select the relevant rows using the Ctrl or Shift keys and then select a check box in this table. Alternatively, drag the cursor over the relevant rows. |
Subnets
Allows you to select the subnets that are shown in the Graphics view.
| Item | Description |
|---|---|
 Auto-zoom Auto-zoom |
Toggle this button for a selected item in the list to automatically focus the view on it. Alternatively, use the Zoom Area button to zoom in on it. |
|
|
For each subnet that is listed in the Layers table, select the associated check box to display it in the Graphics view. Click the header to reverse the order in which selected and unselected subnets are displayed in the table. |
| Subnet | Lists the disconnected subnets in increasing size. The smallest subnet is listed first. Click the Subnet header to reverse the order in which they are displayed in the table. |

|
Shows the color in which the associated subnet is displayed on the canvas. Subnets that you select in the list are highlighted in the color cyan in the Graphics view. |
Message Box
If you click an item in the Graphics view or Subnets table, then information regarding the selected item is displayed in the Message box at the bottom of the dialog. For example, clicking an individual subnet displays further details about it.
